OPEN-SOURCE SCRIPT
Stochastic OB/OS Zones Heatmap
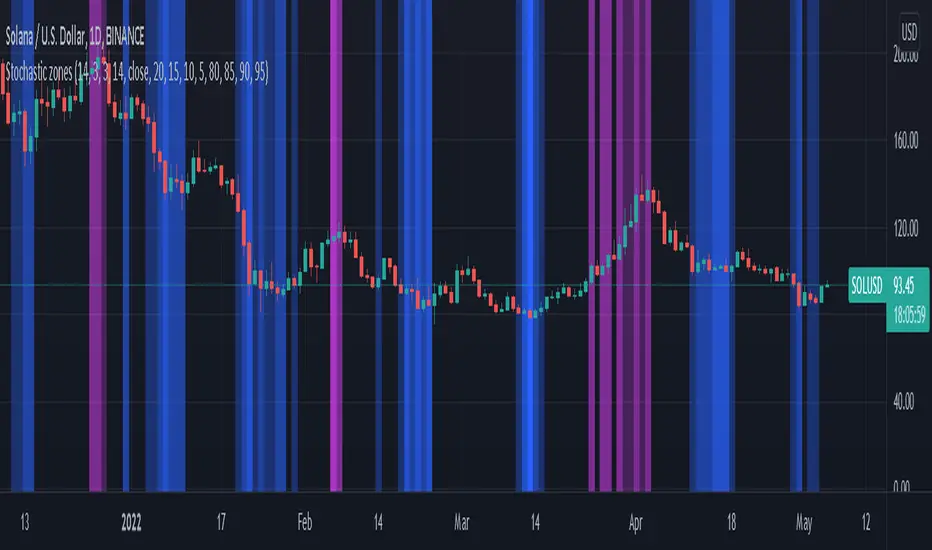
The code is based on the Stochastic RSI Heatmap, but uses a normal Stochastic instead the Stochastic RSI when calculating "k" for more accuracy. Credit for the idea goes to Indicator-Jones.
The heatmap starts from the oversold (20) / overbought (80) levels respectively. The more oversold / overbought the price, the more intense the color (blue / fuchsia)
The heatmap starts from the oversold (20) / overbought (80) levels respectively. The more oversold / overbought the price, the more intense the color (blue / fuchsia)
Open-source script
In true TradingView spirit, the creator of this script has made it open-source, so that traders can review and verify its functionality. Kudos to the author! While you can use it for free, remember that republishing the code is subject to our House Rules.
Disclaimer
The information and publications are not meant to be, and do not constitute, financial, investment, trading, or other types of advice or recommendations supplied or endorsed by TradingView. Read more in the Terms of Use.