OPEN-SOURCE SCRIPT
Consolidation Zones[RanaAlgo]
Overview
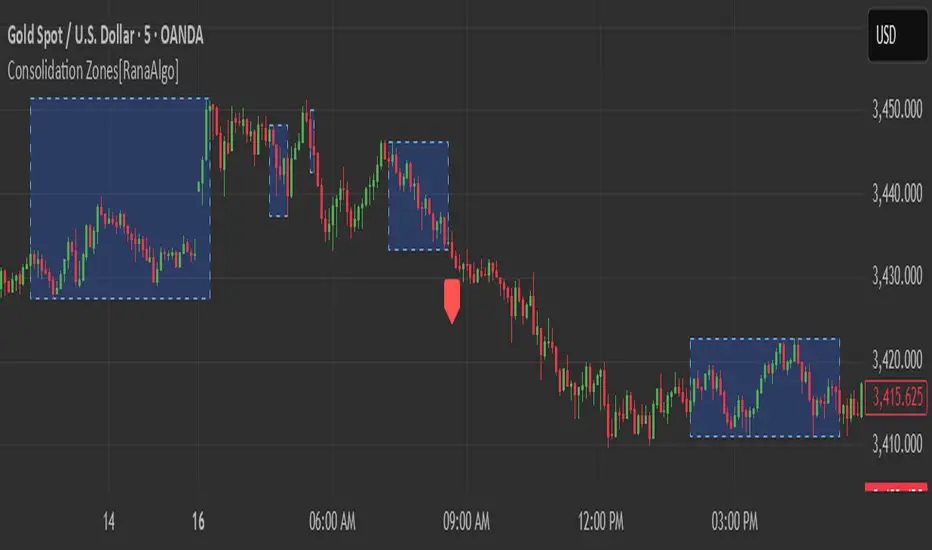
This indicator helps traders identify price consolidation zones (ranges) and potential breakouts in the market. It is useful for spotting periods of low volatility before significant price movements.
How It Works
Detects Consolidation Zones
Uses the ADX (Average Directional Index) to determine when the market is in a consolidation phase .
When ADX is below the threshold , the indicator marks the start of a consolidation zone.
Draws a semi-transparent box around the price range, adjusting its height as new highs/lows form.
Tracks Breakouts
When price breaks above/below the consolidation box, it signals a potential trend continuation.
Displays breakout arrows/labels (configurable shape & style) when price exits the range.
Visual Features
Boxes highlight consolidation areas (customizable color, border, and style).
Labels show real-time status ("CONSOLIDATING" or "TRENDING").
Breakout signals appear as arrows or shapes (up/down).
Usefulness in Trading
Range Trading: Helps traders identify sideways markets for buying low and selling high.
Breakout Trading: Signals potential trend entries when price exits consolidation.
Trend Confirmation: Low ADX + consolidation box = weak trend; breakout = possible trend start.
Example: If price stays in a blue box (consolidation) and then breaks above with an arrow, it suggests a bullish move.
Open-source script
In true TradingView spirit, the creator of this script has made it open-source, so that traders can review and verify its functionality. Kudos to the author! While you can use it for free, remember that republishing the code is subject to our House Rules.
Disclaimer
The information and publications are not meant to be, and do not constitute, financial, investment, trading, or other types of advice or recommendations supplied or endorsed by TradingView. Read more in the Terms of Use.