OPEN-SOURCE SCRIPT
Keltner Zones
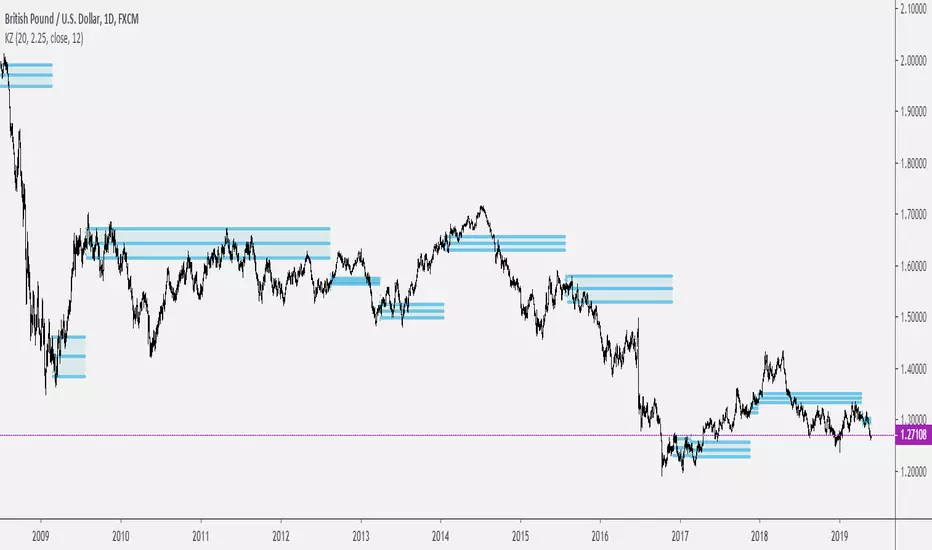
This is an indicator that draws support and resistance zones / levels based on price action in and around Keltner Channels.
There are 3 different modes;
You can also decide if you want the indicator to paint zones or levels. The Zones can grow rather large if there is a volatility shock since they are drawn using the true range around the trigger price.
Upper Band Zones

Lower Band Zones

Congestion Zone

There are 3 different modes;
- Draw zones based on price breaking the upper band
- Draw zones based on price breaking the lower band
- Draw zones if price stays within the bands for a prolonged period of time.
You can also decide if you want the indicator to paint zones or levels. The Zones can grow rather large if there is a volatility shock since they are drawn using the true range around the trigger price.
Upper Band Zones
Lower Band Zones
Congestion Zone
Open-source script
In true TradingView spirit, the creator of this script has made it open-source, so that traders can review and verify its functionality. Kudos to the author! While you can use it for free, remember that republishing the code is subject to our House Rules.
Disclaimer
The information and publications are not meant to be, and do not constitute, financial, investment, trading, or other types of advice or recommendations supplied or endorsed by TradingView. Read more in the Terms of Use.