OPEN-SOURCE SCRIPT
Dynamic Sigma VWAP and Volume Sigma Levels
Ever Wondered How can you confidently Identify Reversals / and Trend Direction with Volume ?
So this Script will help you out with that!
What I am talking About?
1. Volume Standard Deviations Spikes being Projected Over the Price
2. Dynamic VWAP being Calculated from the Points of extremities in Volume Action {estimated using Standard Deviation Sigma Level}
So,
This is how sigma levels of 1sigma, 2sigma and 3sigma will look over the volume

Whenever Volume Spikes through these Sigma Levels,
Price Projections are Formed by this Indicator, both on Current Timeframes and Higher Timeframes Prices
So,
This is what price projection of Volume Sigma Levels (1,2,3sigmas crosses) will look if projected on Same Timeframe period

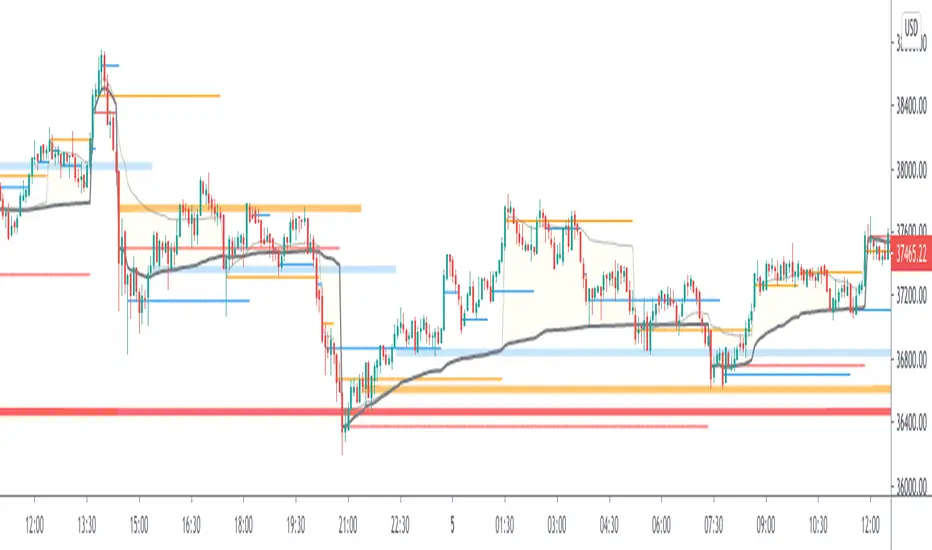
And This is how they look on chart using Higher Timeframe Period, (Default Higher Time Frame is 60mins, You can tweak as per your convenience)


Once All the Sigmas are projected Over the Price,
Dynamic VWAP is calculated from the points where volume crosses current Time Frame 2sigma and 3sigma Levels
see,

This helps out in figuring a lot of things in the price volume action!
Play with it, and Enjoy!
So this Script will help you out with that!
What I am talking About?
1. Volume Standard Deviations Spikes being Projected Over the Price
2. Dynamic VWAP being Calculated from the Points of extremities in Volume Action {estimated using Standard Deviation Sigma Level}
So,
This is how sigma levels of 1sigma, 2sigma and 3sigma will look over the volume
Whenever Volume Spikes through these Sigma Levels,
Price Projections are Formed by this Indicator, both on Current Timeframes and Higher Timeframes Prices
So,
This is what price projection of Volume Sigma Levels (1,2,3sigmas crosses) will look if projected on Same Timeframe period
And This is how they look on chart using Higher Timeframe Period, (Default Higher Time Frame is 60mins, You can tweak as per your convenience)
Once All the Sigmas are projected Over the Price,
Dynamic VWAP is calculated from the points where volume crosses current Time Frame 2sigma and 3sigma Levels
see,
This helps out in figuring a lot of things in the price volume action!
Play with it, and Enjoy!
Open-source script
In true TradingView spirit, the creator of this script has made it open-source, so that traders can review and verify its functionality. Kudos to the author! While you can use it for free, remember that republishing the code is subject to our House Rules.
Get Ocs Ai Trader, Your personal Ai Trade Assistant here
→ ocstrader.com
About me
AlgoTrading Certification, ( University of Oxford, Säid Business School )
PGP Research Analysis, ( NISM, SEBI )
Electronics Engineer
→ ocstrader.com
About me
AlgoTrading Certification, ( University of Oxford, Säid Business School )
PGP Research Analysis, ( NISM, SEBI )
Electronics Engineer
Disclaimer
The information and publications are not meant to be, and do not constitute, financial, investment, trading, or other types of advice or recommendations supplied or endorsed by TradingView. Read more in the Terms of Use.