ReversalSAR
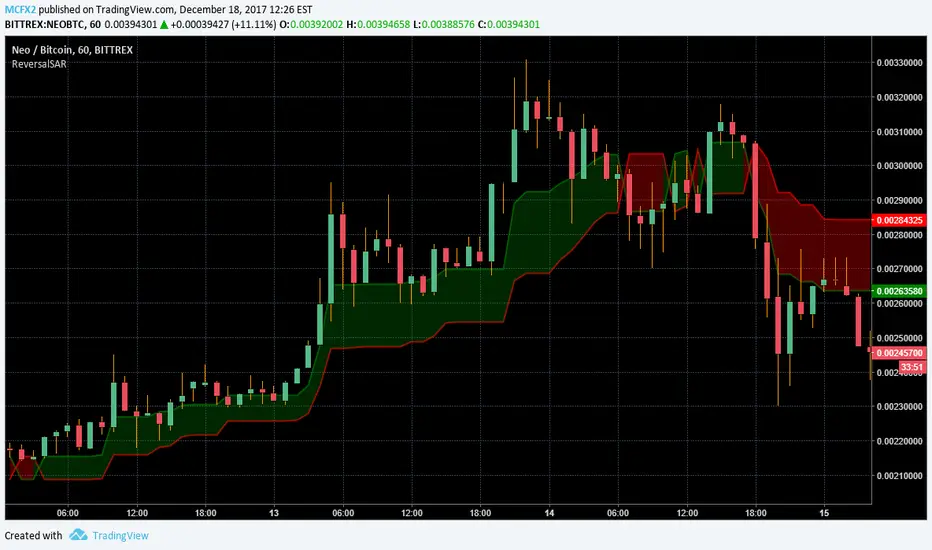
There are two lines, a green SAR line and a red Reversal line. When the bulls are in power, the SAR line acts as a support and is on top, and the Reversal line indicates a bearish reversal when crossed. When the bears are in power, the SAR line acts as a resistance and the Reversal line indicates a bullish reversal when crossed,
You can also see whether the SAR line is acting as a resistance or support based on the color of the cloud between them. The cloud is considered a high risk area. Buying inside the cloud carries the maximum potential profit, and the maximum potential risk.
Invite-only script
Only users approved by the author can access this script. You'll need to request and get permission to use it. This is typically granted after payment. For more details, follow the author's instructions below or contact MCFX2 directly.
TradingView does NOT recommend paying for or using a script unless you fully trust its author and understand how it works. You may also find free, open-source alternatives in our community scripts.
Author's instructions
Warning: please read our guide for invite-only scripts before requesting access.
Disclaimer
Invite-only script
Only users approved by the author can access this script. You'll need to request and get permission to use it. This is typically granted after payment. For more details, follow the author's instructions below or contact MCFX2 directly.
TradingView does NOT recommend paying for or using a script unless you fully trust its author and understand how it works. You may also find free, open-source alternatives in our community scripts.
Author's instructions
Warning: please read our guide for invite-only scripts before requesting access.