OPEN-SOURCE SCRIPT
Heatbands
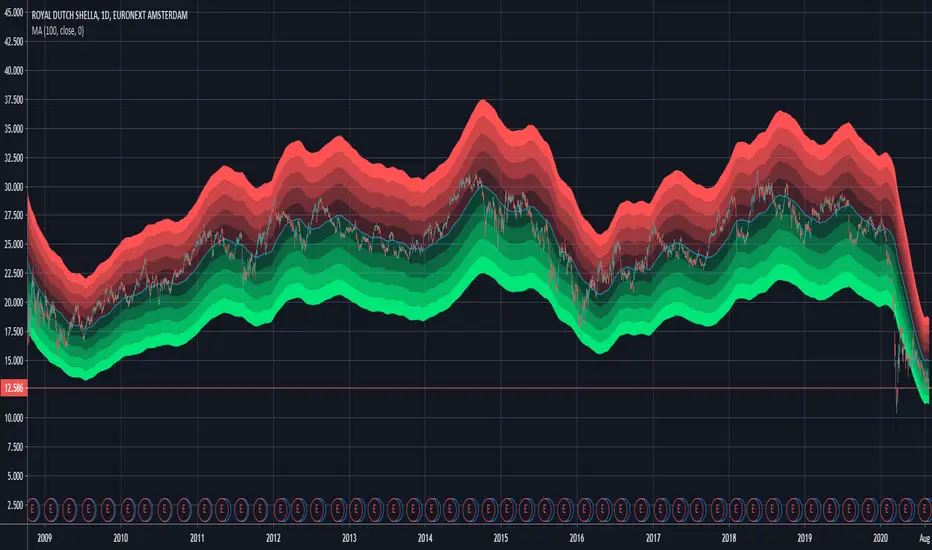
What you see is the 100 day moving average (blue line in the middle) with percentage bands attached to it.
Each color has a 5% range.
The brightest green color is 20%-25% below the 100 day moving average.
The brightest red color is 20%-25% above the 100 day moving average.
The behaviour of the stock price between the bands could give you trading ideas.
The moving average length is adjustable.
The range between the bands is not adjustable (maybe in future updates).
Enjoy:)
Open-source script
In true TradingView spirit, the creator of this script has made it open-source, so that traders can review and verify its functionality. Kudos to the author! While you can use it for free, remember that republishing the code is subject to our House Rules.
Disclaimer
The information and publications are not meant to be, and do not constitute, financial, investment, trading, or other types of advice or recommendations supplied or endorsed by TradingView. Read more in the Terms of Use.