OPEN-SOURCE SCRIPT
Updated [#ps #mft] RDT's Real Relative Strength
Indicator to use with Pine Screener for filtering watchlists with RDT's Real Relative Strength.
See r/realdaytrading for more info on the RRS.
How to:
1. Mark the indicator as "Favorite".
2. Open Pine Screener.
3. Choose a watchlist.
4. Choose this indicator.
5. Change the settings as needed.
6. Make sure you set timeframe to "5 minutes" and not the default "1 day".
If you choose "Bullish trend", then "Signal X" is a shortcut for RRS > 0 for that timeframe. Similarly "Bearish trend" for "Signal X" means RRS < 0.
Pro-tip #1: use Symbol syncing between tabs to easily go over the results.
Pro-tip #2: you can have two tabs open for "Bullish" and "Bearish" pine screeners (even synced to the same color), so you don't have to change settings everytime.
Release Notes
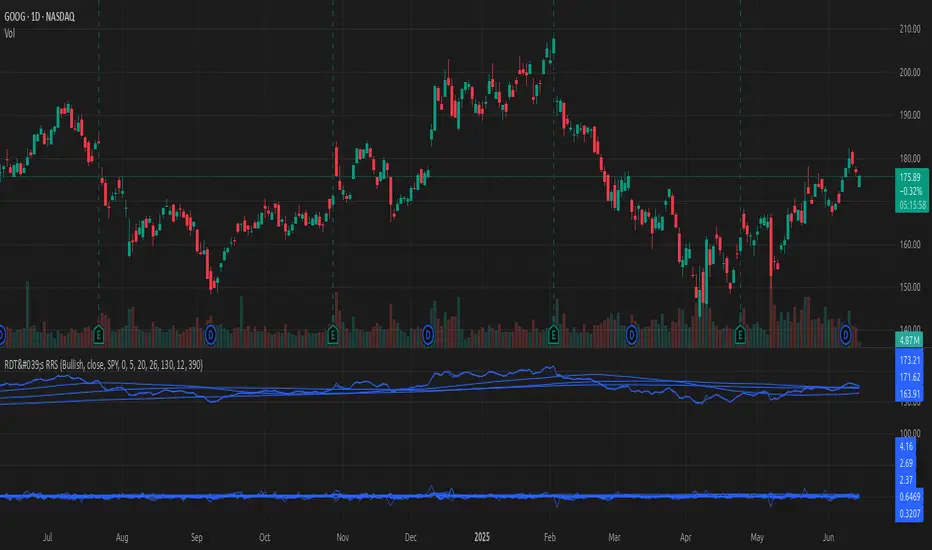
Indicator to use with Pine Screener for filtering watchlists with RDT's Real Relative Strength.The Real Relative Strength (RRS) metric quantifies how a given ticker has been performing compared to a benchmark / market. It assumes that most stocks move with the market's trend / cycles most of the time. If over a given period the market has mktPC (market Price Change) and mktATR (market ATR), we'd expect that the ticker's PC would be
mktPC / mktATR * ATR
The RRS metric expresses the ticker's strength / weakness relative to the market's as follows:
RRS = (PC - expectedPC) / ATR
If RRS is above 0 then the ticker is outperforming the market over the given period.
See r/realdaytrading for more info on the RRS.
THIS IS NOT MEANT TO BE USED AS A VISUAL INDICATOR
The purpose of this script is to be used with a Pine Screener, to be able to sort watchlists by RRS.
How to:
1. Mark the indicator as "Favorite".
2. Open Pine Screener.
3. Choose a watchlist.
4. Choose this indicator.
5. Change the settings as needed.
6. Make sure you set timeframe to "5 minutes" and not the default "1 day".
If you choose "Bullish trend", then "Signal X" is a shortcut for RRS > 0 for that timeframe. Similarly "Bearish trend" for "Signal X" means RRS < 0.
Pro-tip #1: use Symbol syncing between tabs to easily go over the results.
Pro-tip #2: you can have two tabs open for "Bullish" and "Bearish" pine screeners (even synced to the same color), so you don't have to change settings everytime.
Release Notes
Quality of life and bug fixes:- Default timeframe is now set to 1D. You don't need to change it every time anymore.
- Added treshold for RRS in settings. If you want your abs(RRS) to be greater than some small value for example.
- Added confirmation checkbox on each timeframe for RRS. This is useful if you use the scanner intraday.
- Added Heikin-Ashi continuation counts. If you want to know how many consecutive flat top/bottom candles are on each timeframe. This is always _confirmed_ candles only.
- Added daily SMA 50, 100, and 200 values. You can filter using those.
Open-source script
In true TradingView spirit, the creator of this script has made it open-source, so that traders can review and verify its functionality. Kudos to the author! While you can use it for free, remember that republishing the code is subject to our House Rules.
Disclaimer
The information and publications are not meant to be, and do not constitute, financial, investment, trading, or other types of advice or recommendations supplied or endorsed by TradingView. Read more in the Terms of Use.