OPEN-SOURCE SCRIPT
OGT Intrinsic Value Indicator
OGT Intrinsic Value Indicator
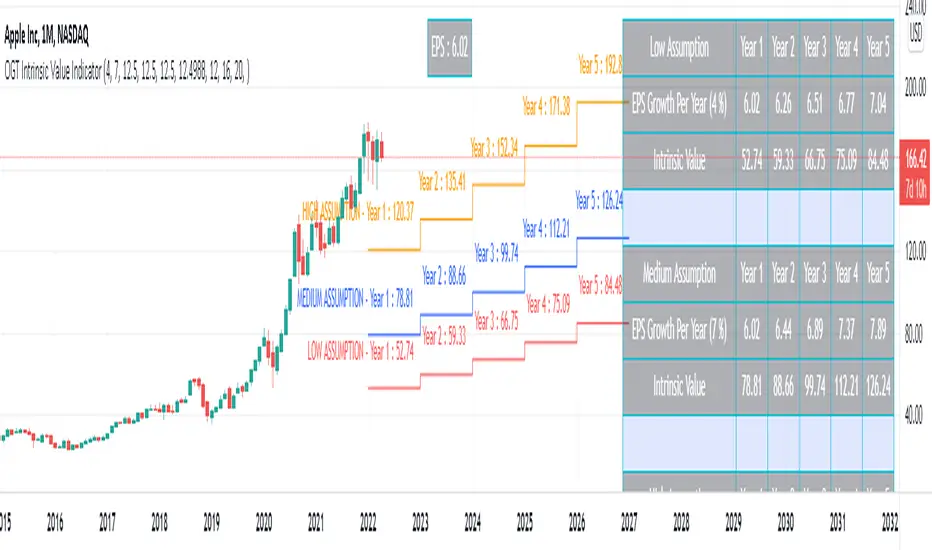
This indicator will show you visually the intrinsic value of a stock. Intrinsic value aims to measure of what an asset is worth. There are a number of intrinsic valuation models where this TradingView indicator uses an earnings valuation model.
There are 4 inputs to the model:
1) EPS trailing 12 months (ttm) - the first step is to know what the current EPS is for a stock. The indicator calculates this for you
2) Annual EPS Growth Next 5 Years - You need to input what you think the annual growth rate is going to be for the stock. You can use you annual estimates which you can obtain by searching "stock name - eps growth forecast"
3) Earnings Multiple (PE Ratio) - The next step is to input the earnings multiple in year 5. You can get this from analyst estimates or looking at the average PE ratio of the asset over the past 3 / 5 / 10 years.
4) Desired Rate Of Return - The last input is your rate of return. I personally use 12.5% as you can invest in an S&P ETF and get 8-10% return. So I prefer a higher rate of return for the risk I am taking.
You will need to input your low, medium and high assumptions so you can see the different price ranges.
Open-source script
In true TradingView spirit, the creator of this script has made it open-source, so that traders can review and verify its functionality. Kudos to the author! While you can use it for free, remember that republishing the code is subject to our House Rules.
Disclaimer
The information and publications are not meant to be, and do not constitute, financial, investment, trading, or other types of advice or recommendations supplied or endorsed by TradingView. Read more in the Terms of Use.