OPEN-SOURCE SCRIPT
VWAP %B
VWAP %B - Volume Weighted Average Price Percent B
The VWAP %B indicator combines the reliability of VWAP (Volume Weighted Average Price) with the analytical power of %B oscillators, similar to Bollinger Bands %B but using volume-weighted statistics.
## How It Works
This indicator calculates where the current price sits relative to VWAP-based standard deviation bands, expressed as a percentage from 0 to 1:
• **VWAP Calculation**: Uses volume-weighted average price as the center line
• **Standard Deviation Bands**: Creates upper and lower bands using standard deviation around VWAP
• **%B Formula**: %B = (Price - Lower Band) / (Upper Band - Lower Band)
## Key Levels & Interpretation
• **Above 1.0**: Price is trading above the upper VWAP band (strong bullish momentum)
• **0.8 - 1.0**: Overbought territory, potential resistance
• **0.5**: Price exactly at VWAP (equilibrium)
• **0.2 - 0.0**: Oversold territory, potential support
• **Below 0.0**: Price is trading below the lower VWAP band (strong bearish momentum)
## Trading Applications
**Trend Following**: During strong trends, breaks above 1.0 or below 0.0 often signal continuation rather than reversal.
**Mean Reversion**: In ranging markets, extreme readings (>0.8 or <0.2) may indicate potential reversal points.
**Volume Context**: Unlike traditional %B, this incorporates volume weighting, making it more reliable during high-volume periods.
## Parameters
• **Length (20)**: Period for standard deviation calculation
• **Standard Deviation Multiplier (2.0)**: Controls band width
• **Source (close)**: Price input for calculations
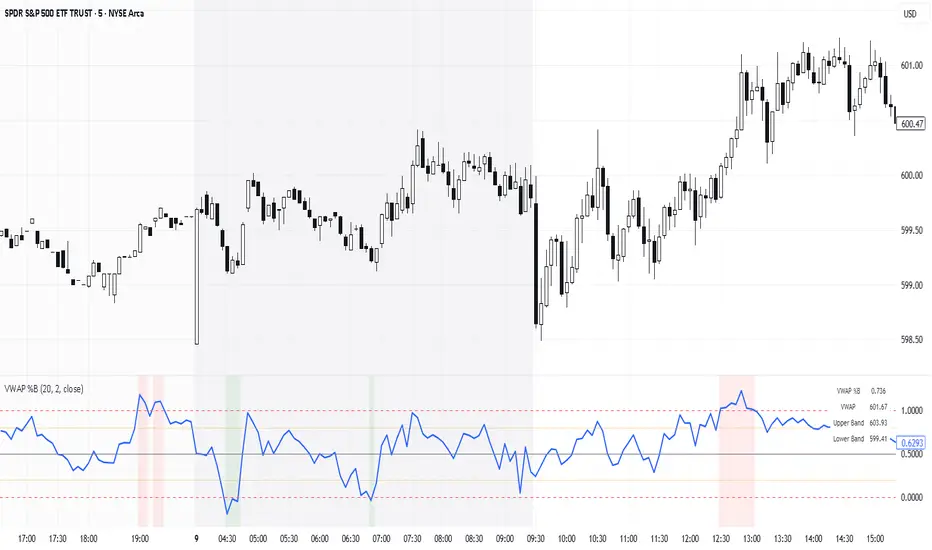
## Visual Features
• Reference lines at key levels (0, 0.2, 0.5, 0.8, 1.0)
• Background highlighting for extreme breaks
• Real-time values table
• Clean oscillator format below price chart
Perfect for intraday traders and swing traders who want to combine volume analysis with momentum oscillators.
The VWAP %B indicator combines the reliability of VWAP (Volume Weighted Average Price) with the analytical power of %B oscillators, similar to Bollinger Bands %B but using volume-weighted statistics.
## How It Works
This indicator calculates where the current price sits relative to VWAP-based standard deviation bands, expressed as a percentage from 0 to 1:
• **VWAP Calculation**: Uses volume-weighted average price as the center line
• **Standard Deviation Bands**: Creates upper and lower bands using standard deviation around VWAP
• **%B Formula**: %B = (Price - Lower Band) / (Upper Band - Lower Band)
## Key Levels & Interpretation
• **Above 1.0**: Price is trading above the upper VWAP band (strong bullish momentum)
• **0.8 - 1.0**: Overbought territory, potential resistance
• **0.5**: Price exactly at VWAP (equilibrium)
• **0.2 - 0.0**: Oversold territory, potential support
• **Below 0.0**: Price is trading below the lower VWAP band (strong bearish momentum)
## Trading Applications
**Trend Following**: During strong trends, breaks above 1.0 or below 0.0 often signal continuation rather than reversal.
**Mean Reversion**: In ranging markets, extreme readings (>0.8 or <0.2) may indicate potential reversal points.
**Volume Context**: Unlike traditional %B, this incorporates volume weighting, making it more reliable during high-volume periods.
## Parameters
• **Length (20)**: Period for standard deviation calculation
• **Standard Deviation Multiplier (2.0)**: Controls band width
• **Source (close)**: Price input for calculations
## Visual Features
• Reference lines at key levels (0, 0.2, 0.5, 0.8, 1.0)
• Background highlighting for extreme breaks
• Real-time values table
• Clean oscillator format below price chart
Perfect for intraday traders and swing traders who want to combine volume analysis with momentum oscillators.
Open-source script
In true TradingView spirit, the creator of this script has made it open-source, so that traders can review and verify its functionality. Kudos to the author! While you can use it for free, remember that republishing the code is subject to our House Rules.
Disclaimer
The information and publications are not meant to be, and do not constitute, financial, investment, trading, or other types of advice or recommendations supplied or endorsed by TradingView. Read more in the Terms of Use.