OPEN-SOURCE SCRIPT
Updated Weekly Change(Green&Red) & Percentage Change(Blue&Yellow)
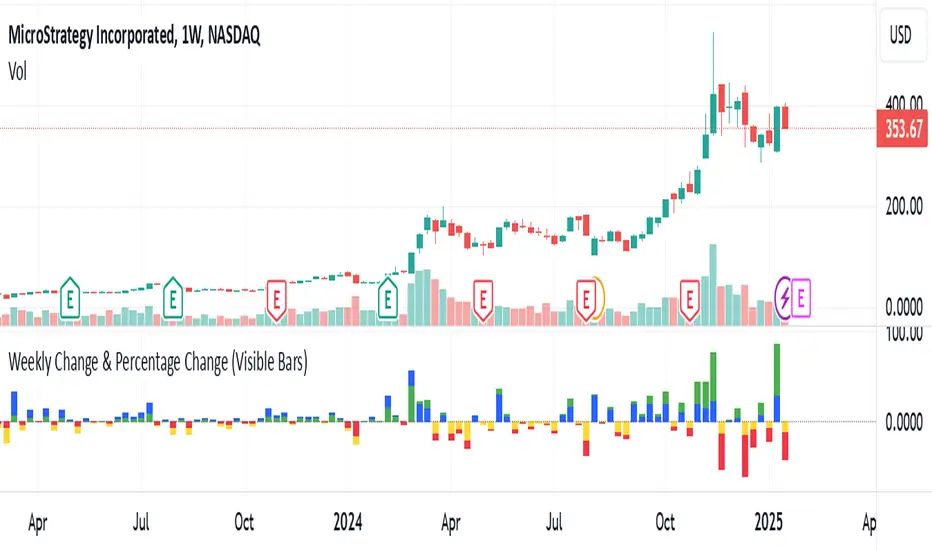
Display bar chart of weekly price action. Use to determine the maximum price change in one week. It would be the possible strike price for a covered call option for weekly income.
Release Notes
Bar chart of weekly price action. Display in percentage and absolute values. Use to determine historical maximum price change weekly, possible strike price for covered call option to create weekly income.Open-source script
In true TradingView spirit, the creator of this script has made it open-source, so that traders can review and verify its functionality. Kudos to the author! While you can use it for free, remember that republishing the code is subject to our House Rules.
Disclaimer
The information and publications are not meant to be, and do not constitute, financial, investment, trading, or other types of advice or recommendations supplied or endorsed by TradingView. Read more in the Terms of Use.
Open-source script
In true TradingView spirit, the creator of this script has made it open-source, so that traders can review and verify its functionality. Kudos to the author! While you can use it for free, remember that republishing the code is subject to our House Rules.
Disclaimer
The information and publications are not meant to be, and do not constitute, financial, investment, trading, or other types of advice or recommendations supplied or endorsed by TradingView. Read more in the Terms of Use.