OPEN-SOURCE SCRIPT
Updated Moving Averages By MoneyTribe21
This custom indicator displays three Smoothed Moving Averages (SMAs) designed to help traders identify market trends, potential reversals, and key support/resistance levels. It is ideal for trend-following strategies, momentum trading, and confirming price direction in various timeframes.
Three Smoothed Moving Averages to track short-term, mid-term, and long-term trends:
21-Day SMA: Captures short-term price momentum and trend direction.
50-Day SMA: Represents the mid-term trend, often used as dynamic support/resistance.
200-Day SMA: The long-term trend filter, commonly watched by institutional traders.
Fully Customizable Settings
Adjust period length for each SMA to fit your strategy.
Modify line colors, thickness, and styles for better visibility.
Enable/disable specific SMAs based on preference.
Works Across All Markets
Compatible with Forex, Stocks, Commodities, Crypto, and Indices.
Supports multiple timeframes (1M, 5M, 1H, Daily, Weekly, etc.)
Release Notes
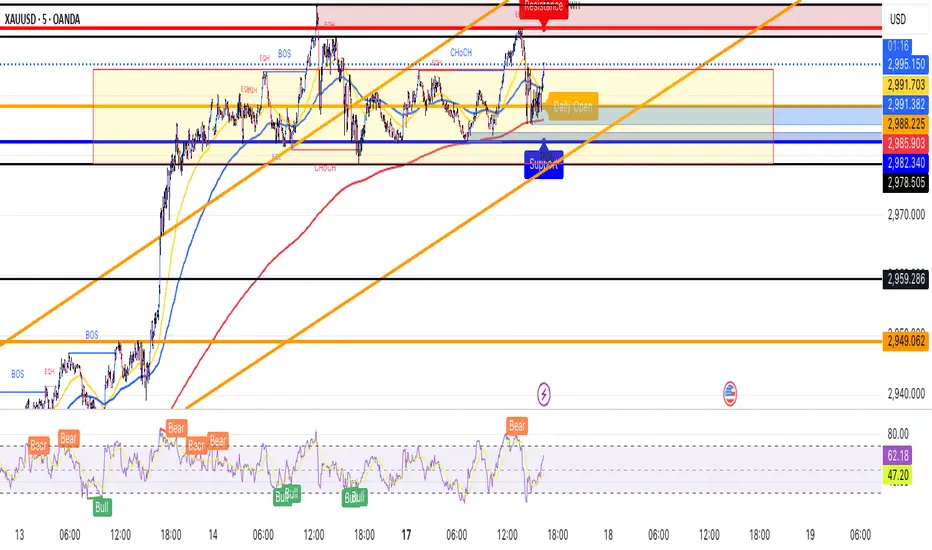
This custom script provides real-time tracking of key market price levels, helping traders identify critical support and resistance zones. It dynamically updates throughout the trading session, making it ideal for intraday trading, breakout strategies, and market structure analysis.Real-Time Tracking of Key Price Levels:
ATH (All-Time High): Tracks the highest price ever reached for the asset.
PDH (Previous Day High): Marks the high of the last trading day, acting as a key resistance level.
PDL (Previous Day Low): Marks the low of the last trading day, serving as dynamic support.
Resistance Level: Based on the current day’s high, signaling potential price rejection points.
Support Level: Based on the current day’s low, indicating potential price bounces.
Daily Open Price: Tracks the exact market open price at the start of the trading session.
Works Across All Timeframes
Designed for intraday, swing, and long-term trading.
Automatically adjusts levels for Forex, Stocks, Crypto, and Indices.
Fully Customizable Settings
Modify line colors, thickness, and styles for better chart readability.
Enable/disable specific levels based on trading preference.
Works on all TradingView-compatible brokers and platforms.
Ideal for Traders Who:
Want high-probability support & resistance zones in real-time.
Trade breakouts, reversals, or trend continuations.
Use market structure analysis for informed decision-making.
Need automatic price tracking instead of drawing levels manually.
Release Notes
This custom indicator displays three Smoothed Moving Averages (SMAs) designed to help traders identify market trends, potential reversals, and key support/resistance levels. It is ideal for trend-following strategies, momentum trading, and confirming price direction in various timeframes.Three Smoothed Moving Averages to track short-term, mid-term, and long-term trends:
21-Day SMA: Captures short-term price momentum and trend direction.
50-Day SMA: Represents the mid-term trend, often used as dynamic support/resistance.
200-Day SMA: The long-term trend filter, commonly watched by institutional traders.
Fully Customizable Settings
Adjust period length for each SMA to fit your strategy.
Modify line colors, thickness, and styles for better visibility.
Enable/disable specific SMAs based on preference.
Works Across All Markets
Compatible with Forex, Stocks, Commodities, Crypto, and Indices.
Supports multiple timeframes (1M, 5M, 1H, Daily, Weekly, etc.)
Open-source script
In true TradingView spirit, the creator of this script has made it open-source, so that traders can review and verify its functionality. Kudos to the author! While you can use it for free, remember that republishing the code is subject to our House Rules.
Disclaimer
The information and publications are not meant to be, and do not constitute, financial, investment, trading, or other types of advice or recommendations supplied or endorsed by TradingView. Read more in the Terms of Use.