OPEN-SOURCE SCRIPT
Updated OCM Quarter Point Autopilot - A Multi-Timeframe Quarter Theory
Description:
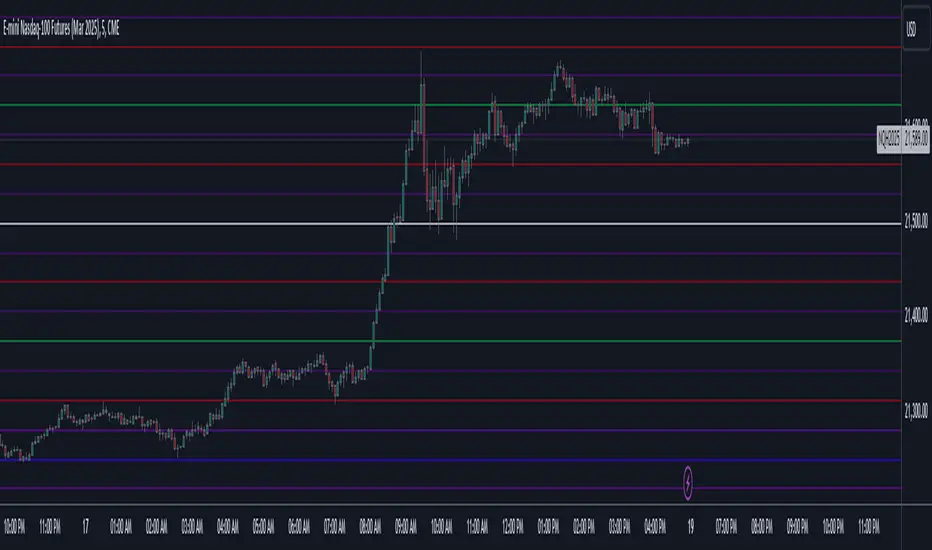
The OCM Quarter Point Autopilot indicator automates the application of Quarters Theory across multiple timeframes and instruments. It creates a comprehensive grid of support and resistance levels based on two user-defined price points (Monthly QTPs).
Key Features:
- Automatically calculates and displays quarter points across 5 timeframes:
• Monthly (Black lines)
• Weekly (Blue lines)
• Daily (Green lines)
• 4-Hour (Red lines)
• 1-Hour (Purple lines)
- Shows both upper and lower ranges, which can be toggled on/off
- Visual hierarchy through color-coding for easy timeframe identification
- Extends lines 2 years into the past and 6 months into the future
Usage:
1. Enter two Monthly Quarter Trading Points (QTPs)
2. The indicator automatically:
- Calculates midpoints (weekly)
- Quarter points (daily)
- Eighth points (4-hour)
- Further subdivisions (1-hour)
Benefits:
- Identifies potential support/resistance levels
- Helps spot key price targets
- Works on any instrument where psychological levels matter
- Provides multiple timeframe analysis in one view
Best suited for traders who:
- Follow multi-timeframe analysis
- Trade using support/resistance levels
- Want to identify potential price targets
- Need structured price levels for entries/exits
The indicator combines the systematic approach of Quarters Theory with automated calculation and visualization, making it easier to identify key price levels across multiple timeframes.
Release Notes
Tweaks to underline script were done for the purpose of future iterations. :-) Release Notes
Simple Publication Fix Open-source script
In true TradingView spirit, the creator of this script has made it open-source, so that traders can review and verify its functionality. Kudos to the author! While you can use it for free, remember that republishing the code is subject to our House Rules.
Disclaimer
The information and publications are not meant to be, and do not constitute, financial, investment, trading, or other types of advice or recommendations supplied or endorsed by TradingView. Read more in the Terms of Use.
Open-source script
In true TradingView spirit, the creator of this script has made it open-source, so that traders can review and verify its functionality. Kudos to the author! While you can use it for free, remember that republishing the code is subject to our House Rules.
Disclaimer
The information and publications are not meant to be, and do not constitute, financial, investment, trading, or other types of advice or recommendations supplied or endorsed by TradingView. Read more in the Terms of Use.