OPEN-SOURCE SCRIPT
Updated Origin VWAP: OVWAP
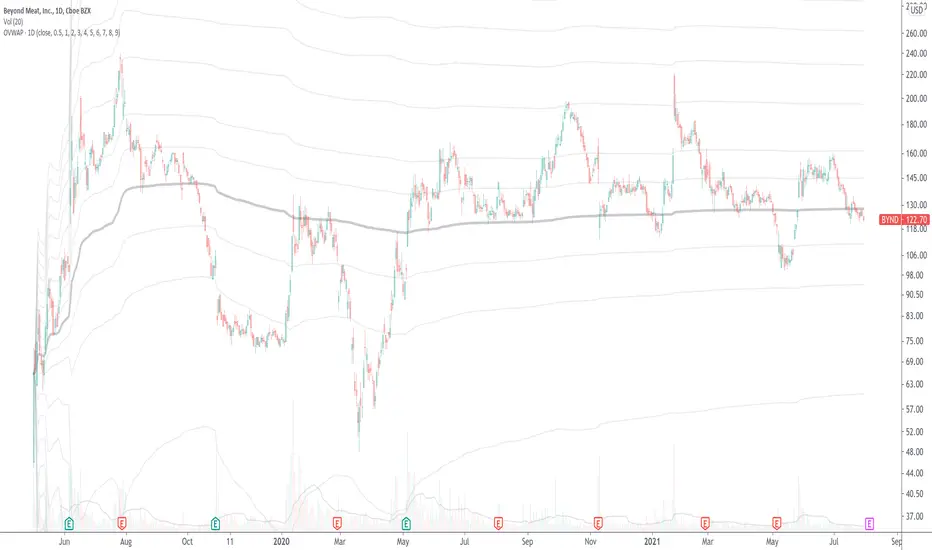
Draw a VWAP support/resistance line anchored to the origin of the data series (like a daily VWAP, but from the beginning of time, never resetting).
Ideally the origin would be the first bar after the IPO. Tradingview (or your connected broker) doesn't always have a complete dataset, and in that case the OVWAP will be 'wrong', but converging to the correct value over time.
You can try to simulate this with the built-in VWAP indicator but it has several bugs and limitations. Firstly, the longest time period is century, but it is not 100 years, ie. a rolling century but the beginning of the century: 21 years ago. Secondly, even if your dataset is less than 21 years, if you use a lower time frame then the built-in VWAP's origin becomes the left-most loaded bar (about 5,000 bars ago) - it will draw the wrong value. The new Anchored VWAP drawing tool can't be used on lower time frames as it won't draw the line at all unless it sees the point where you anchored it.
You may want to cut 'n paste this code to use in some larger strategy. Unfortunately that's probably not possible. This script uses the 'resolution=' option of 'study()' set to '1W', so the whole script runs at the 1 week resolution. You would think it would be possible to instead use the 'security()' function to request data at the '1W' resolution, but it just resamples the current data set and so is limited to the rightmost 5,000 bars.
Look in the options to enable standard deviation lines.
Release Notes
Update standard deviation bands calculation.Release Notes
(Fix example chart to remove stray drawings)Open-source script
In true TradingView spirit, the creator of this script has made it open-source, so that traders can review and verify its functionality. Kudos to the author! While you can use it for free, remember that republishing the code is subject to our House Rules.
Disclaimer
The information and publications are not meant to be, and do not constitute, financial, investment, trading, or other types of advice or recommendations supplied or endorsed by TradingView. Read more in the Terms of Use.
Open-source script
In true TradingView spirit, the creator of this script has made it open-source, so that traders can review and verify its functionality. Kudos to the author! While you can use it for free, remember that republishing the code is subject to our House Rules.
Disclaimer
The information and publications are not meant to be, and do not constitute, financial, investment, trading, or other types of advice or recommendations supplied or endorsed by TradingView. Read more in the Terms of Use.