PROTECTED SOURCE SCRIPT
Updated MACD Enhanced Strategy MTF with Stop Loss [LTB]
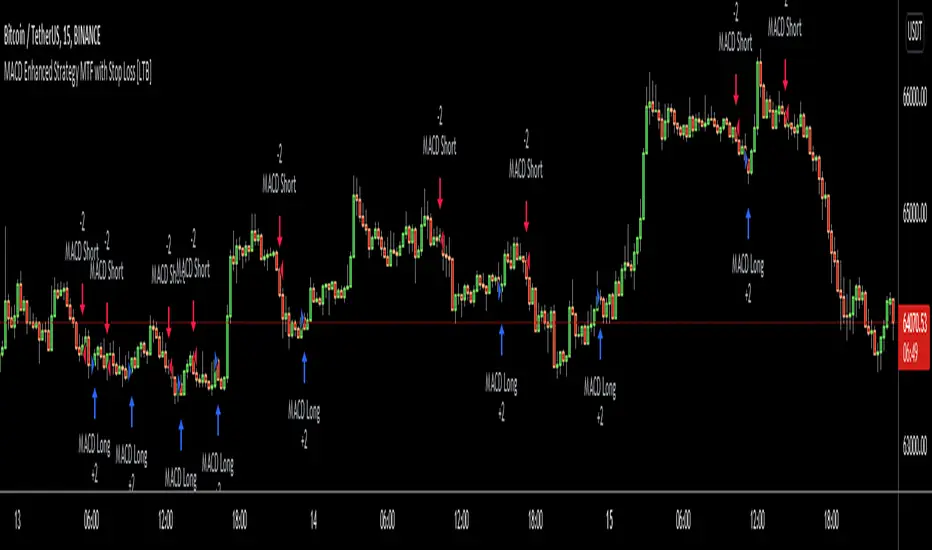
I developed this script to analyse MACD, MACD Signal, MACD Histogram movements by using current and higher time frame. Script calculates higher time frame automatically, no manuel entry. I also added trailing stop loss line. You can change the parameters as you wish ;)
btw. you should know that MACD is more successful when there is trend.
If you like it please comment and check out my other scripts.
btw. you should know that MACD is more successful when there is trend.
If you like it please comment and check out my other scripts.
Release Notes
A few corrections in the code.Release Notes
a few improvements and made optional trailing stop loss line optional.Release Notes
upgraded.many users asking the source code, here it's, you can use it as you wish
// This source code is subject to the terms of the Mozilla Public License 2.0 at https://mozilla.org/MPL/2.0/
// © LonesomeTheBlue
//@version=4
strategy("MACD Enhanced Strategy MTF with Stop Loss [LTB]", overlay=true)
fastLength = input(title="MACD Fast Length", defval=12, minval=1)
slowLength = input(title="MACD Slow Length", defval=26, minval=1)
signalLength = input(title="MACD Signal Length", defval=9, minval=1)
crossscore = input(title="Cross (buy/sell) Score", defval=10.)
indiside = input(title="indicator Direction Score", defval=8)
histside = input(title="Histogram Direction Score", defval=2)
shotsl = input(title="Show Stop Loss Line", defval=false)
Mult = input(title="Stop Loss Factor", defval=1.2, type=input.float, minval=0.1, maxval=100)
Period = input(title="Stop Loss Period", defval=10, minval=1, maxval=100)
lookaheadi = input(title = "Lookahead", defval = true)
HTF = timeframe.period == '1' ? '5' :
timeframe.period == '3' ? '15' : timeframe.period == '5' ? '15' :
timeframe.period == '15' ? '60' : timeframe.period == '30' ? '60' :
timeframe.period == '45' ? '60' : timeframe.period == '60' ? '240' :
timeframe.period == '120' ? '240' : timeframe.period == '180' ? '240' :
timeframe.period == '240' ? 'D' : timeframe.period == 'D' ? 'W' : 'W'
calc = timeframe.period == '1' ? 5 :
timeframe.period == '3' ? 5 : timeframe.period == '5' ? 3 :
timeframe.period == '15' ? 4 : timeframe.period == '30' ? 4 :
timeframe.period == '45' ? 4 : timeframe.period == '60' ? 4 :
timeframe.period == '120' ? 3 : timeframe.period == '180' ? 3 :
timeframe.period == '240' ? 6 : timeframe.period == 'D' ? 5 : 1
count() =>
indi = ema(close, fastLength) - ema(close, slowLength)
signal = ema(indi, signalLength)
Anlyse = 0.0
// direction of indi and histogram
hist = indi - signal
Anlyse := indi > indi[1] ? hist > hist[1] ? indiside + histside :
hist == hist[1] ? indiside : indiside - histside : 0
Anlyse := Anlyse + (indi < indi[1] ? hist < hist[1] ? -(indiside + histside) :
hist == hist[1] ? -indiside : -(indiside - histside) : 0)
Anlyse := Anlyse +
(indi == indi[1] ? hist > hist[1] ? histside : hist < hist[1] ? -histside : 0 : 0)
// cross now earlier ?
countcross = indi >= signal and indi[1] < signal[1] ? crossscore :
indi <= signal and indi[1] > signal[1] ? -crossscore : 0.
countcross := countcross + nz(countcross[1]) * 0.6
Anlyse := Anlyse + countcross
nz(Anlyse)
Anlys = count()
AnlysHfrm = lookaheadi ? security(syminfo.tickerid, HTF, count(), lookahead = barmerge.lookahead_on) :
security(syminfo.tickerid, HTF, count(), lookahead = barmerge.lookahead_off)
Result = (AnlysHfrm * calc + Anlys) / (calc + 1)
longCondition = change(Result) != 0 and Result > 0
if longCondition
strategy.entry("MACD Long", strategy.long)
shortCondition = change(Result) != 0 and Result < 0
if shortCondition
strategy.entry("MACD Short", strategy.short)
countstop(pos) =>
Upt = hl2 - Mult * atr(Period)
Dnt = hl2 + Mult * atr(Period)
TUp = 0.
TDown = 0.
TUp := close[1] > TUp[1] ? max(Upt, TUp[1]) : Upt
TDown := close[1] < TDown[1] ? min(Dnt, TDown[1]) : Dnt
tslmtf = pos == 1 ? TUp : TDown
tslmtf
pos = longCondition ? 1 : -1
stline = 0.
countstop__1 = countstop(pos)
security_1 = security(syminfo.tickerid, HTF, countstop__1)
stline := change(time(HTF)) != 0 or longCondition or shortCondition ? security_1 :
nz(stline[1])
plot(stline, color=shotsl ? color.gray : na, style=plot.style_line, linewidth=2, title="Stop Loss")
P.S. I don't recommend this strategy
Protected script
This script is published as closed-source. However, you can use it freely and without any limitations – learn more here.
Disclaimer
The information and publications are not meant to be, and do not constitute, financial, investment, trading, or other types of advice or recommendations supplied or endorsed by TradingView. Read more in the Terms of Use.