OPEN-SOURCE SCRIPT
RSI-EMA Signal by stock shooter
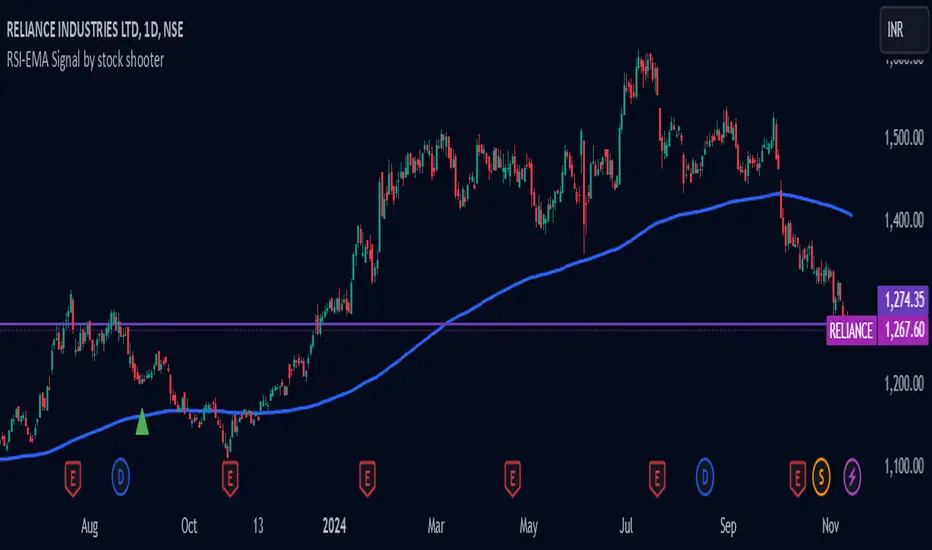
## Strategy Description: 200 EMA Crossover with RSI, Green/Red Candles, Volume, and Exit Conditions
This strategy combines several technical indicators to identify potential long and short entry opportunities in a trading instrument. Here's a breakdown of its components:
1. 200-period Exponential Moving Average (EMA):
* The 200-period EMA acts as a long-term trend indicator.
* The strategy looks for entries when the price is above (long) or below (short) the 200 EMA.
2. Relative Strength Index (RSI):
* The RSI measures the momentum of price movements and helps identify overbought and oversold conditions.
* The strategy looks for entries when the RSI is below 40 (oversold) for long positions and above 60 (overbought) for short positions.
3. Green/Red Candles:
* This indicator filters out potential entries based on the current candle's closing price relative to its opening price.
* The strategy only considers long entries on green candles (closing price higher than opening) and short entries on red candles (closing price lower than opening).
4. Volume:
* This indicator adds a volume filter to the entry conditions.
* The strategy only considers entries when the current candle's volume is higher than the average volume of the previous 20 candles, aiming for stronger signals.
Overall:
This strategy aims to capture long opportunities during potential uptrends and short opportunities during downtrends, based on a combination of price action, momentum, and volume confirmation.
Important Notes:
Backtesting is crucial to evaluate the historical performance of this strategy before deploying it with real capital.
Consider incorporating additional risk management techniques like stop-loss orders.
This strategy is just a starting point and can be further customized based on your trading goals and risk tolerance.
Open-source script
In true TradingView spirit, the creator of this script has made it open-source, so that traders can review and verify its functionality. Kudos to the author! While you can use it for free, remember that republishing the code is subject to our House Rules.
Disclaimer
The information and publications are not meant to be, and do not constitute, financial, investment, trading, or other types of advice or recommendations supplied or endorsed by TradingView. Read more in the Terms of Use.