OPEN-SOURCE SCRIPT
10-Day Avg Upside vs Downside Volume
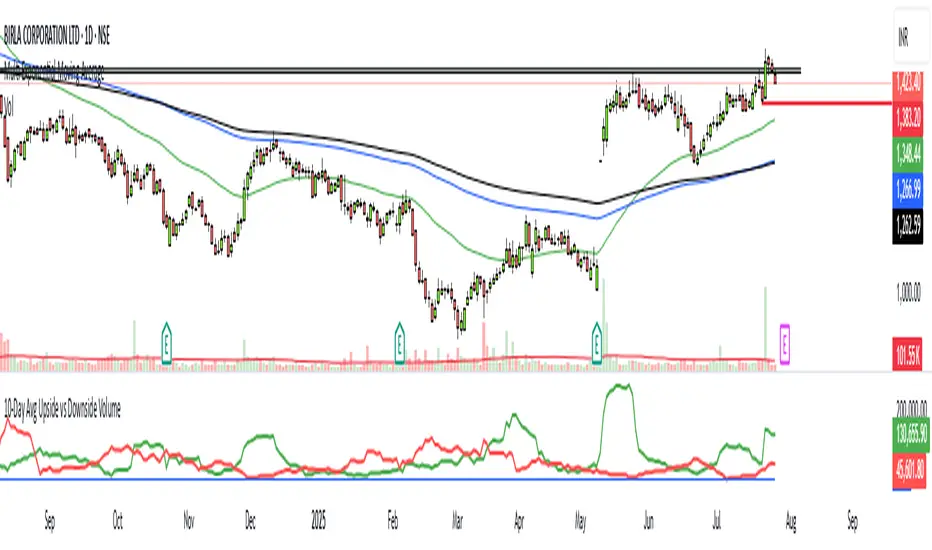
Upside Volume: The total volume on days when the stock closes higher than the previous day.
Downside Volume: The total volume on days when the stock closes lower than the previous day.
It calculates the 10-day simple moving average of both upside and downside volumes.
An optional ratio line is included to visualize relative buying vs selling pressure.
Downside Volume: The total volume on days when the stock closes lower than the previous day.
It calculates the 10-day simple moving average of both upside and downside volumes.
An optional ratio line is included to visualize relative buying vs selling pressure.
Open-source script
In true TradingView spirit, the creator of this script has made it open-source, so that traders can review and verify its functionality. Kudos to the author! While you can use it for free, remember that republishing the code is subject to our House Rules.
Disclaimer
The information and publications are not meant to be, and do not constitute, financial, investment, trading, or other types of advice or recommendations supplied or endorsed by TradingView. Read more in the Terms of Use.