OPEN-SOURCE SCRIPT
Taylor Series Forecast
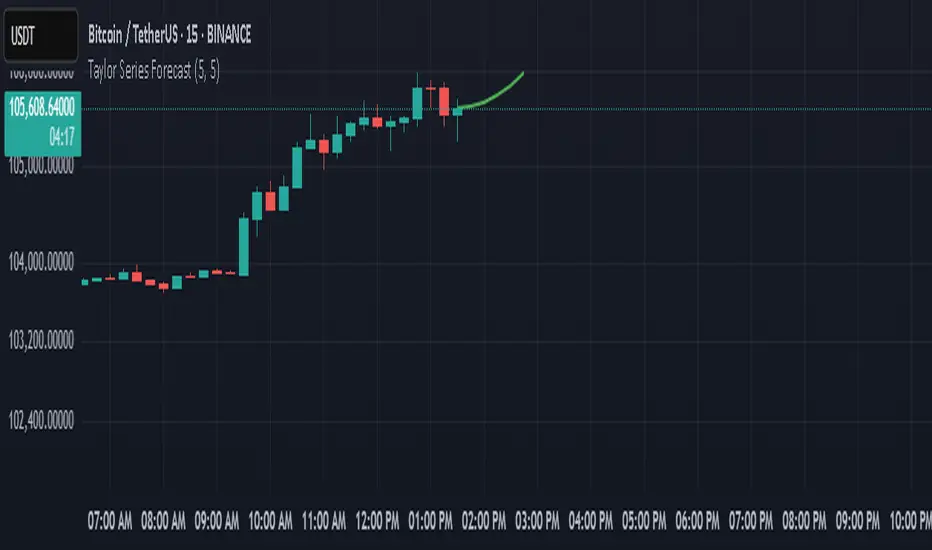
This indicator projects future price movement using a second-order Taylor Series expansion, calculated from a smoothed price (EMA). It models price momentum and acceleration to generate a forward-looking trajectory.
Forecast points are plotted continuously as connected line segments extending into the future. Each segment is color-coded based on slope:
Green indicates an upward slope (bullish forecast).
Red indicates a downward slope (bearish forecast).
The forecast adapts to current market conditions and updates dynamically with each new bar. Useful for visualizing potential future price paths and identifying directional bias based on recent price action.
Inputs:
Max Forecast Horizon: How many bars into the future the forecast extends.
EMA Smoothing Length: The smoothing applied to price before calculating derivatives.
This tool is experimental and should be used in conjunction with other analysis methods. It does not guarantee future price performance.
Open-source script
In true TradingView spirit, the creator of this script has made it open-source, so that traders can review and verify its functionality. Kudos to the author! While you can use it for free, remember that republishing the code is subject to our House Rules.
Disclaimer
The information and publications are not meant to be, and do not constitute, financial, investment, trading, or other types of advice or recommendations supplied or endorsed by TradingView. Read more in the Terms of Use.