OPEN-SOURCE SCRIPT
Updated Fractal Series History Summary
This script presents a summarized view of a series by drawing lines between series samples taken at power-of-two intervals from the current value.
The intent is to provide a visualization of trendlines at multiple scales, without having to untangle those that my overlap each other.
It doesn't overlay a price-chart as written; it could, but IMHO that would be redundant. It's intended to augment oscillators and other kinds of indicators that don't necessarily scale with a price chart.
The script does not attempt to provide buy or sell triggers, but rather, to provide a visualization tool and a line-drawing tech-demo.
Release Notes
- Calculate deltas forwards, not backwards
Remove normalization
Default to absolute values, overlay=true
Release Notes
Added a function to display momentum chords to each sampled node, which was my original inspiration for this script.Reverted to tip-first drawing order, which is simpler and actually draws the oldest visible lines.
Release Notes
Refactored, added "Average" and "Linear Regression" as basis for fractal history. (The latter greatly improves the accuracy and stability of the historical summary.)Note #1: This indicator repaints by nature.
Note #2: It is not intended to provide buy or sell signals.
Release Notes
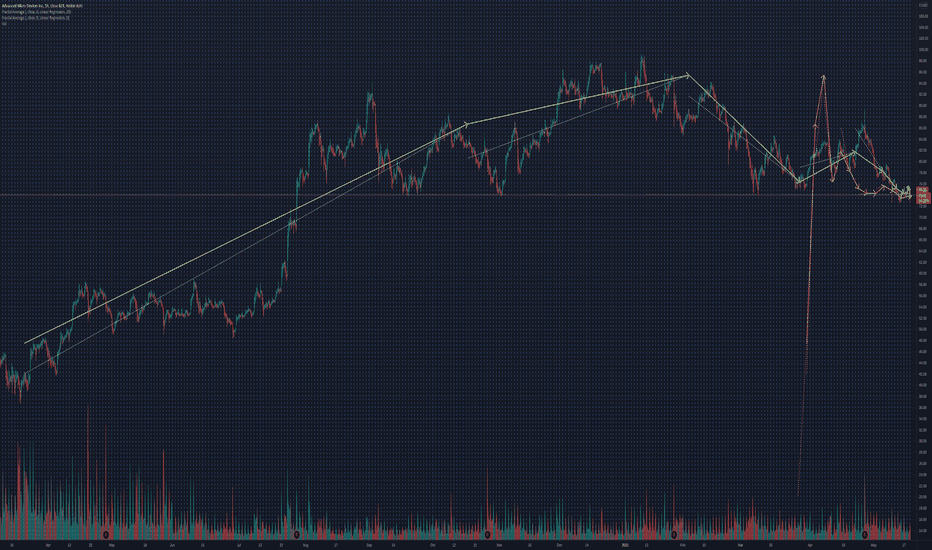
Fixed some comments, but mainly wanted to update chart to improve visibility of the indicatorRelease Notes
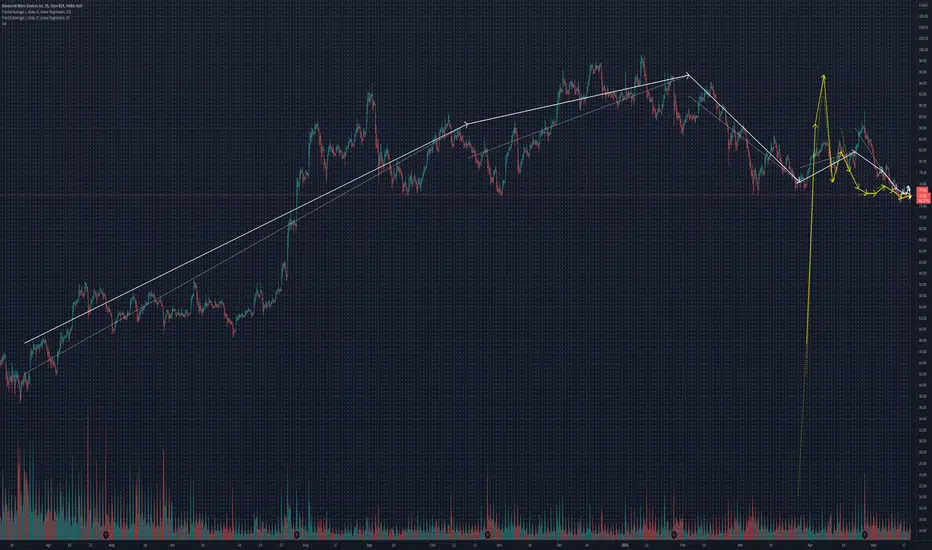
Added an option to display the fractal historical summary in Log Time, which can visually exaggerate recent information and compress information from the more distant past.Adjusting the "Log(time) Factor" parameter will shrink or stretch the summary to your taste (use 0 for linear time.)
(Linear time in white, Log time in yellow)
Open-source script
In true TradingView spirit, the creator of this script has made it open-source, so that traders can review and verify its functionality. Kudos to the author! While you can use it for free, remember that republishing the code is subject to our House Rules.
Disclaimer
The information and publications are not meant to be, and do not constitute, financial, investment, trading, or other types of advice or recommendations supplied or endorsed by TradingView. Read more in the Terms of Use.