OPEN-SOURCE SCRIPT
Multi-SMA Dashboard (10 SMAs)
Description:
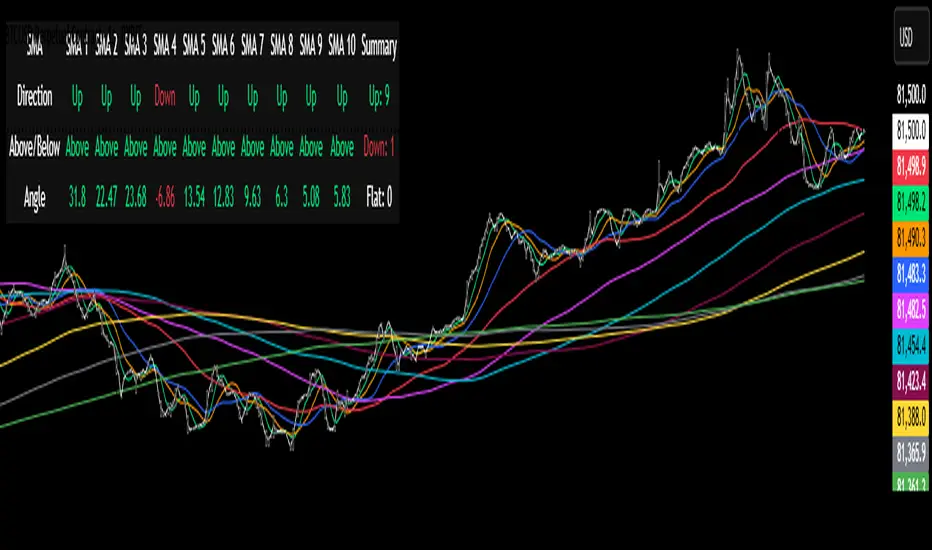
This script, "Multi-SMA Dashboard (10 SMAs)," creates a dashboard on a TradingView chart to analyze ten Simple Moving Averages (SMAs) of varying lengths. It overlays the chart and displays a table with each SMA’s direction, price position relative to the SMA, and angle of movement, providing a comprehensive trend overview.
How It Works:
1. **Inputs**: Users define lengths for 10 SMAs (default: 5, 10, 20, 50, 100, 150, 200, 250, 300, 350), select a price source (default: close), and customize table appearance and options like angle units (degrees/radians) and debug plots.
2. **SMA Calculation**: Computes 10 SMAs using the `ta.sma()` function with user-specified lengths and price source.
3. **Direction Determination**: The `sma_direction()` function checks each SMA’s trend:
- "Up" if current SMA > previous SMA.
- "Down" if current SMA < previous SMA.
- "Flat" if equal (no strength distinction).
4. **Price Position**: Compares the price source to each SMA, labeling it "Above" or "Below."
5. **Angle Calculation**: Tracks the most recent direction change point for each SMA and calculates its angle (atan of price change over time) in degrees or radians, based on the `showInRadians` toggle.
6. **Table Display**: A 12-column table shows:
- Columns 1-10: SMA name, direction (Up/Down/Flat), Above/Below status, and angle.
- Column 11: Summary of Up, Down, and Flat counts.
- Colors reflect direction (lime for Up/Above, red for Down/Below, white for Flat).
7. **Debug Option**: Optionally plots all SMAs and price for visual verification when `debug_plots_toggle` is enabled.
Indicators Used:
- Simple Moving Averages (SMAs): 10 user-configurable SMAs ranging from short-term (e.g., 5) to long-term (e.g., 350) periods.
The script runs continuously, updating the table on each bar, and overlays the chart to assist traders in assessing multi-timeframe trend direction and momentum without cluttering the view unless debug mode is active.
Open-source script
In true TradingView spirit, the creator of this script has made it open-source, so that traders can review and verify its functionality. Kudos to the author! While you can use it for free, remember that republishing the code is subject to our House Rules.
Disclaimer
The information and publications are not meant to be, and do not constitute, financial, investment, trading, or other types of advice or recommendations supplied or endorsed by TradingView. Read more in the Terms of Use.