OPEN-SOURCE SCRIPT
Updated Percentage up/down
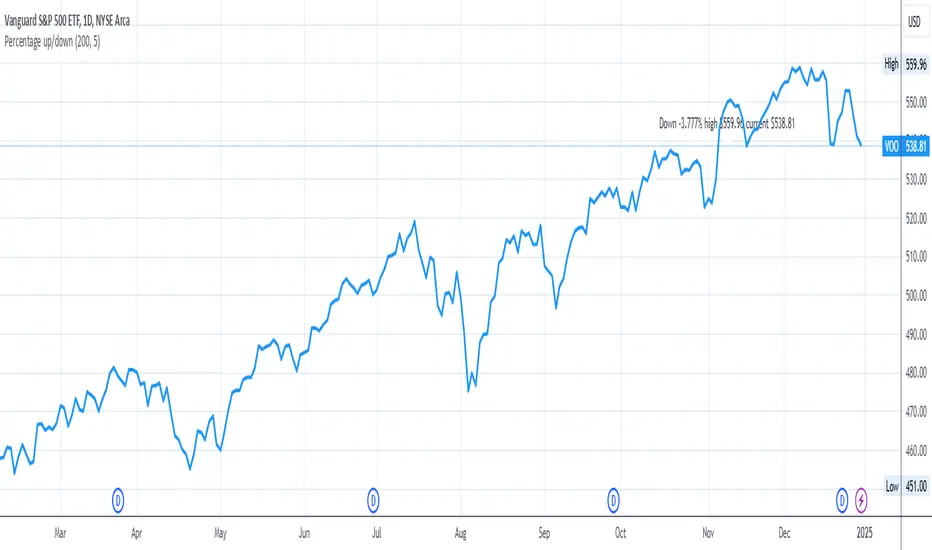
In order to buy stocks, I want to know how much the stock went down from the all-time high price. Therefore, this script shows how much the current stock has dropped from the all-time high.
You can change:
- how many periods to get the all-time high from
- location on the y-axis to place the label on the chart
You can change:
- how many periods to get the all-time high from
- location on the y-axis to place the label on the chart
Release Notes
Updated script to version 6Changed the text and background color to make the text visible
Open-source script
In true TradingView spirit, the creator of this script has made it open-source, so that traders can review and verify its functionality. Kudos to the author! While you can use it for free, remember that republishing the code is subject to our House Rules.
Disclaimer
The information and publications are not meant to be, and do not constitute, financial, investment, trading, or other types of advice or recommendations supplied or endorsed by TradingView. Read more in the Terms of Use.