OPEN-SOURCE SCRIPT
Updated Range Level [plx]
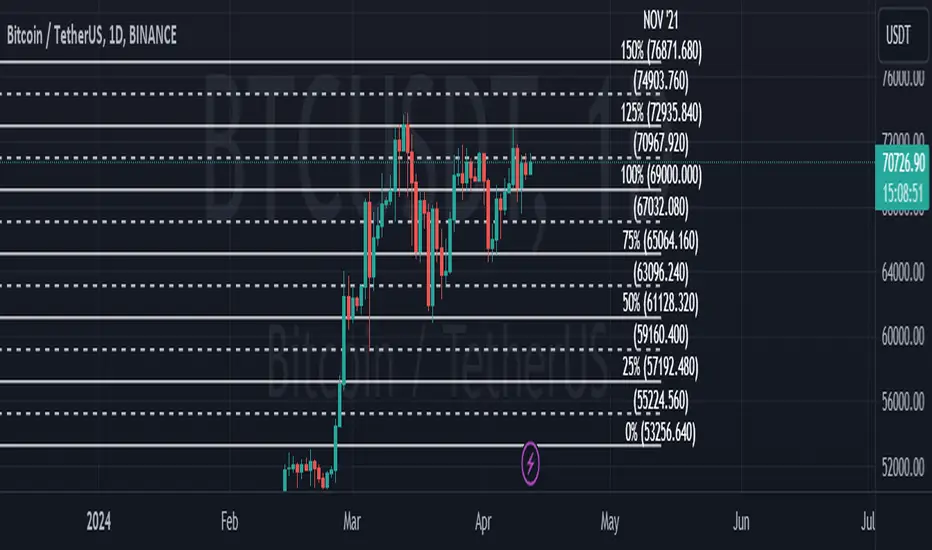
This indicator automatically draws Fibonacci levels based on your selected timeframe: Monday, Monthly, or Quarterly.
For instance, if you choose Monday, it plots Fibonacci levels (0, 0.25, 0.5, 0.75, 1) based on that day's candle. You can also opt to display titles on the top right of each line for clarity.
Additionally, it offers the feature to show a dashed line between levels for easier visualization of the midpoint.
Designed for educational purposes.
Release Notes
This indicator automatically draws Fibonacci levels based on your selected timeframe: Monday, Monthly, or Quarterly.For instance, if you choose Monday, it plots Fibonacci levels (0, 0.25, 0.5, 0.75, 1) based on that day's candle. You can also opt to display titles on the top right of each line for clarity.
Additionally, it offers the feature to show a dashed line between levels for easier visualization of the midpoint.
Designed for educational purposes.
Release Notes
replace numbering formatOpen-source script
In true TradingView spirit, the creator of this script has made it open-source, so that traders can review and verify its functionality. Kudos to the author! While you can use it for free, remember that republishing the code is subject to our House Rules.
Disclaimer
The information and publications are not meant to be, and do not constitute, financial, investment, trading, or other types of advice or recommendations supplied or endorsed by TradingView. Read more in the Terms of Use.
Open-source script
In true TradingView spirit, the creator of this script has made it open-source, so that traders can review and verify its functionality. Kudos to the author! While you can use it for free, remember that republishing the code is subject to our House Rules.
Disclaimer
The information and publications are not meant to be, and do not constitute, financial, investment, trading, or other types of advice or recommendations supplied or endorsed by TradingView. Read more in the Terms of Use.