OPEN-SOURCE SCRIPT
Smart OBs
Smart Order Block Indicator with Mitigation Detection
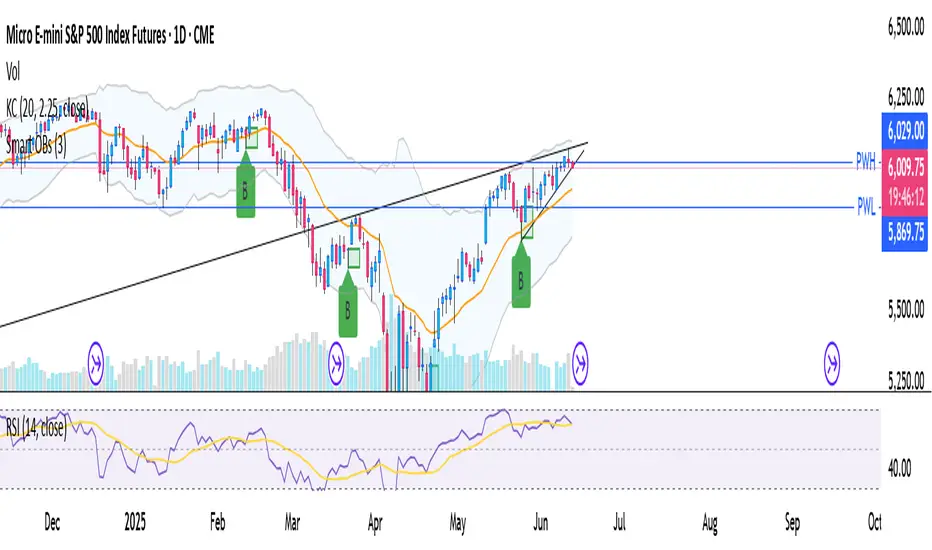
This indicator identifies bullish and bearish order blocks on the chart using a price action-based logic. For a bearish order block, it detects a candle whose high is higher than the highs of the candles immediately before and after it, followed by a candle after the next one whose high is below the low of the order block candle. Conversely, a bullish order block is identified where a candle’s low is lower than the lows of its neighboring candles and the subsequent candle after next has a low above the high of the order block candle. This method helps to spot potential areas where institutional buying or selling occurred.
Once identified, the indicator plots rectangular zones on the chart highlighting these order blocks, allowing traders to visualize key supply and demand areas. The zones extend forward by a configurable number of bars to anticipate potential future price reactions. Additionally, the indicator checks if the order block zone has been “mitigated” or “consumed” by current price action, meaning price has retraced into or through the zone, potentially weakening its strength. Mitigated zones are not replotted, keeping the chart cleaner.
This tool assists traders in spotting high-probability reversal or continuation zones, aiding in entry, stop-loss, and take-profit placement decisions by visually marking institutional order flow areas.
Open-source script
In true TradingView spirit, the creator of this script has made it open-source, so that traders can review and verify its functionality. Kudos to the author! While you can use it for free, remember that republishing the code is subject to our House Rules.
Disclaimer
The information and publications are not meant to be, and do not constitute, financial, investment, trading, or other types of advice or recommendations supplied or endorsed by TradingView. Read more in the Terms of Use.