OPEN-SOURCE SCRIPT
One Year Return
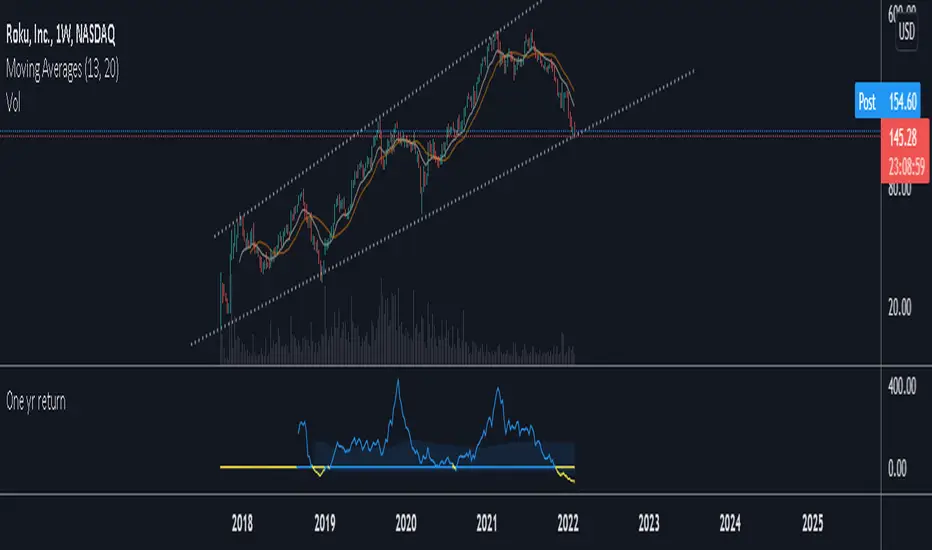
This is a script meant for the weekly timeframe . It shows the change between the current close and the close 52 bars ago. I find that this data can be useful for deciding how long to stay in a trade, and for deciding how far a stock is likely to move in a year based on it's historical returns. The High average takes the sum of all positive returns and averages it using the number of bars where the data was positive, the low average does the same but with all the returns below zero. When both are turned on you will see a band between these values.
Open-source script
In true TradingView spirit, the creator of this script has made it open-source, so that traders can review and verify its functionality. Kudos to the author! While you can use it for free, remember that republishing the code is subject to our House Rules.
Disclaimer
The information and publications are not meant to be, and do not constitute, financial, investment, trading, or other types of advice or recommendations supplied or endorsed by TradingView. Read more in the Terms of Use.