OPEN-SOURCE SCRIPT
London/NY Sessions [jpkxyz]
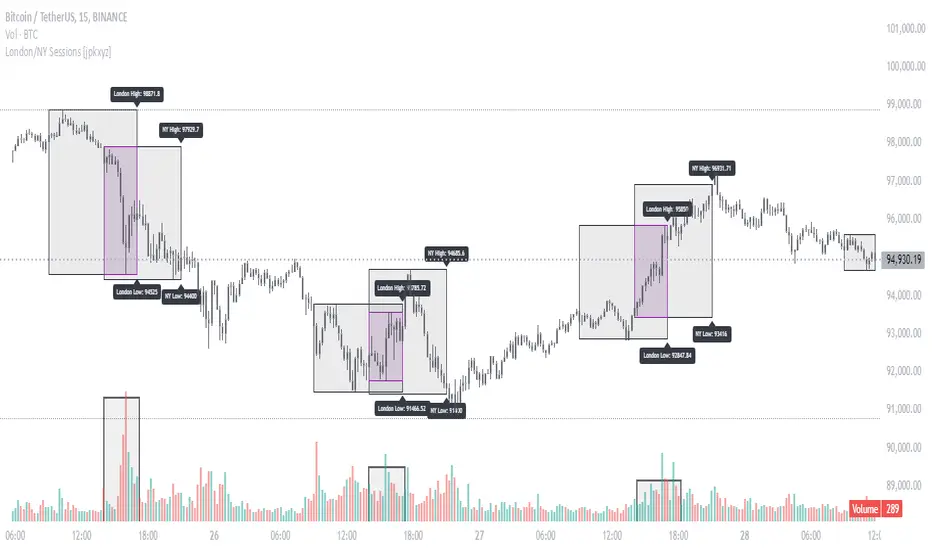
London/NY Sessions Indicator Guide
This indicator tracks the forex market's most active trading periods: London session, New York session, and their overlap.
This characteristics of the London and New York trading sessions are well documented and many traders use them as a key element in their trading strategies. It is most relevant in forex trading, however it is to an extend also applicable in cryptocurrencies.
London Session (08:00-16:00 UTC)
Most active trading session (35% of daily forex volume)
Highest trading volume and liquidity
Major price movements and trend development
Significant institutional participation
New York Session (13:00-20:00 UTC)
Second most active trading period
High institutional order flow
Major US economic releases
Significant impact on USD pairs
London/New York Overlap (13:00-16:00 UTC)
The most active period in forex markets:
Maximum market liquidity
Highest daily trading volume
Strong price movements
Tightest spreads
Peak institutional activity
This indicator helps traders:
Visualize key trading sessions
Track session highs and lows
Monitor overlap dynamics
Identify potential support/resistance levels (session highs/lows)
Open-source script
In true TradingView spirit, the creator of this script has made it open-source, so that traders can review and verify its functionality. Kudos to the author! While you can use it for free, remember that republishing the code is subject to our House Rules.
Disclaimer
The information and publications are not meant to be, and do not constitute, financial, investment, trading, or other types of advice or recommendations supplied or endorsed by TradingView. Read more in the Terms of Use.