OPEN-SOURCE SCRIPT
Z-Scored Pi Cycle Top & Bottom
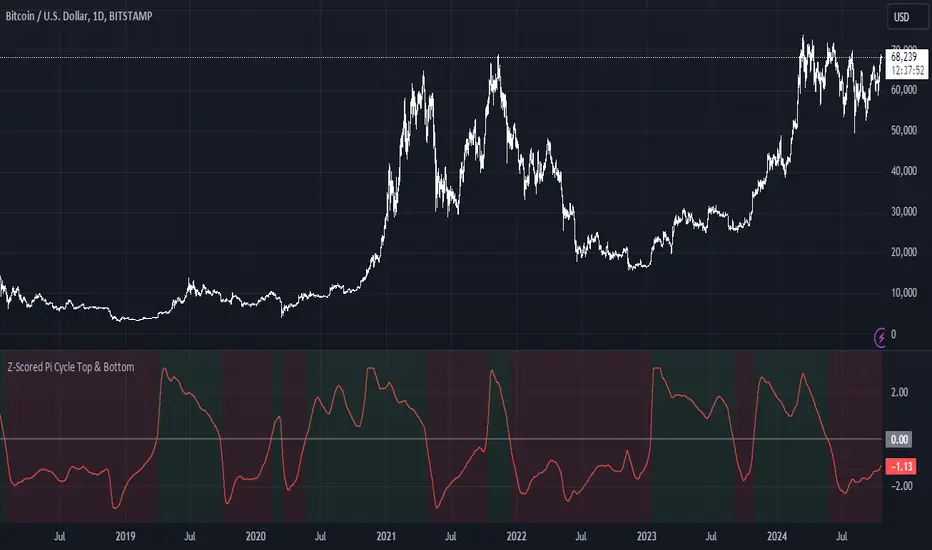
This indicator calculates the Z-score of the Pi Cycle Top & Bottom indicator to identify potential market cycle tops and bottoms. It uses the relationship between two EMAs (111 and 350) to assess the price action and applies a Z-score to determine how far the current value deviates from the mean, providing a normalized measure of overbought and oversold conditions.
Summary:
The Z-Scored Pi Cycle Top & Bottom indicator is designed to help traders identify significant market cycle extremes by applying a Z-score to the Pi Cycle Top & Bottom ratio (EMA 111/EMA 350). This normalized score ranges between -2.99 and 2.99, with values near the extremes suggesting potential market tops or bottoms. Green shading indicates a positive Z-score (potential top), while red shading indicates a negative Z-score (potential bottom).
Use this indicator to gauge where the market stands relative to historical tops and bottoms, allowing for more informed decision-making in both bull and bear markets. The indicator also displays the absolute value of the Z-score in the label, helping traders easily visualize how far the current market is from historical extremes.
**I did not come up with or create this indicator I have just z scored it and made it easier for myself to use.***
Open-source script
In true TradingView spirit, the creator of this script has made it open-source, so that traders can review and verify its functionality. Kudos to the author! While you can use it for free, remember that republishing the code is subject to our House Rules.
Disclaimer
The information and publications are not meant to be, and do not constitute, financial, investment, trading, or other types of advice or recommendations supplied or endorsed by TradingView. Read more in the Terms of Use.