OPEN-SOURCE SCRIPT
Updated Triple Average True Range Channel
Definition: By ADAM HAYES from Investopedia -- Updated Jul 8, 2019
The average true range (ATR) is a technical analysis indicator that measures market volatility by decomposing the entire range of an asset price for that period. Specifically, ATR is a measure of volatility introduced by market technician J. Welles Wilder Jr. in his book, "New Concepts in Technical Trading Systems."
The true range indicator is taken as the greatest of the following: current high less the current low; the absolute value of the current high less the previous close; and the absolute value of the current low less the previous close. The average true range is then a moving average, generally using 14 days, of the true ranges.
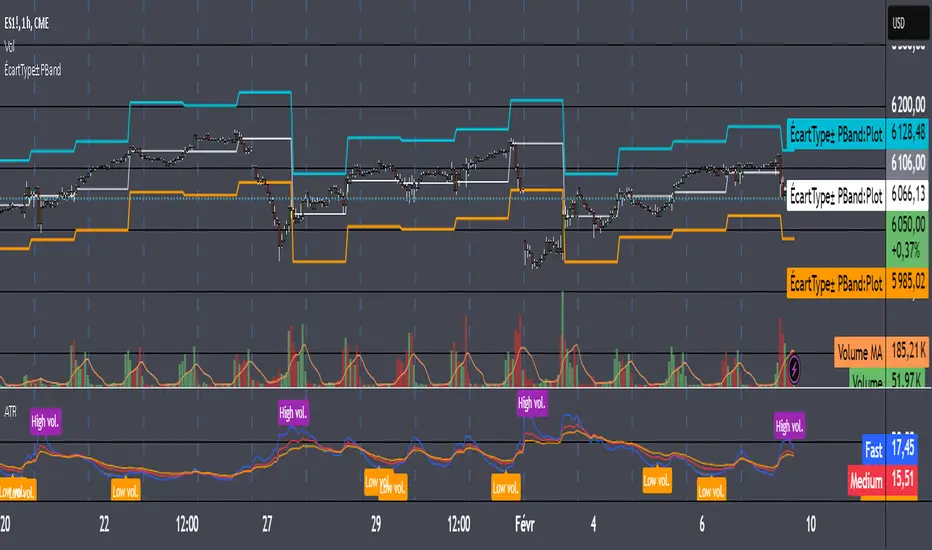
I've added a channel perspective from a certain % from the Slow Average Length that user will have to configure depending of resolution and the markets instruments they chose...
Also a fill is used to easily point out when a high distance between a fast and a slow volatility analysis is occurring.
Which is also denotated with a shaped label...
Share and comment my work :)
The average true range (ATR) is a technical analysis indicator that measures market volatility by decomposing the entire range of an asset price for that period. Specifically, ATR is a measure of volatility introduced by market technician J. Welles Wilder Jr. in his book, "New Concepts in Technical Trading Systems."
The true range indicator is taken as the greatest of the following: current high less the current low; the absolute value of the current high less the previous close; and the absolute value of the current low less the previous close. The average true range is then a moving average, generally using 14 days, of the true ranges.
I've added a channel perspective from a certain % from the Slow Average Length that user will have to configure depending of resolution and the markets instruments they chose...
Also a fill is used to easily point out when a high distance between a fast and a slow volatility analysis is occurring.
Which is also denotated with a shaped label...
Share and comment my work :)
Release Notes
Open-source script
In true TradingView spirit, the creator of this script has made it open-source, so that traders can review and verify its functionality. Kudos to the author! While you can use it for free, remember that republishing the code is subject to our House Rules.
Disclaimer
The information and publications are not meant to be, and do not constitute, financial, investment, trading, or other types of advice or recommendations supplied or endorsed by TradingView. Read more in the Terms of Use.