OPEN-SOURCE SCRIPT
ΔPrecio/Vol + EMA NetVol Escalada RJF V1
Indicator Manual: ΔPrice/Vol + EMA NetVolume (Scaled)
1. Introduction
This indicator combines the histogram of (Close – Open) divided by volume with a dynamically scaled EMA of net volume. It helps identify the strength of price movements tied to buying vs. selling volume.
2. Input Parameters
Show Histogram (ΔPrice/Vol): Enable or disable the (Close - Open) / Volume histogram.
Histogram Up Color: Color for positive histogram bars.
Histogram Down Color: Color for negative histogram bars.
Histogram Zero Color: Color for zero-value histogram bars.
Show EMA NetVolume: Enable or disable the net volume EMA line.
EMA NetVolume Period: Number of bars for the net volume EMA calculation.
EMA Up Color: Color for the EMA when net volume is positive.
EMA Down Color: Color for the EMA when net volume is negative.
EMA Line Width: Thickness of the EMA line.
Dynamic Scale Window: Number of bars for calculating the EMA scaling factor.
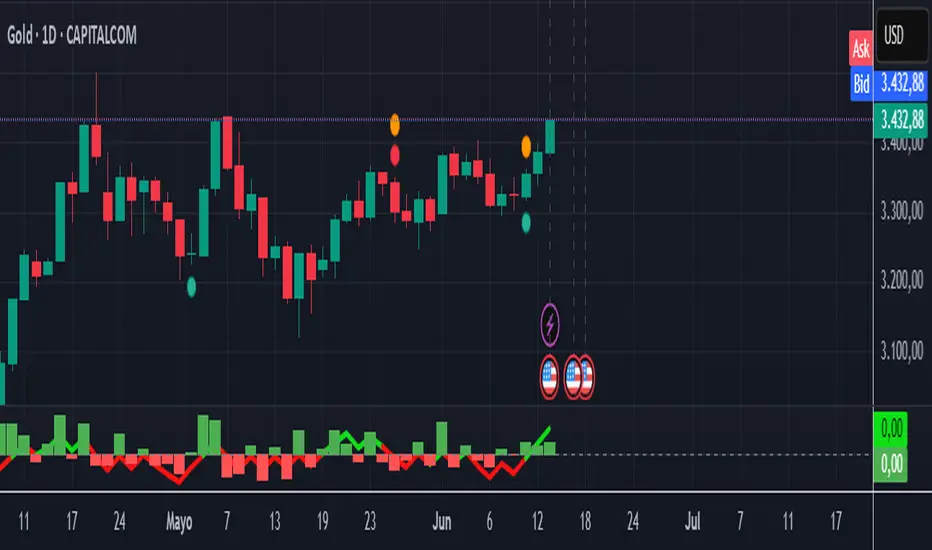
3. Visualization and Interpretation
• The histogram displays (Close – Open) / Volume, colored by candle direction.
• The net volume EMA shows accumulated buying vs. selling volume.
• EMA above zero indicates buying dominance; below zero indicates selling dominance.
• Both series share the same zero line for easy comparison.
4. Examples of Use
• During a strong uptrend, expect large green histogram bars and the EMA in positive territory.
• In a retracement, red histogram bars appear more frequently and the EMA may cross below zero.
• Adjust the dynamic scale window to fine-tune EMA sensitivity.
5. Troubleshooting
• If you do not see the histogram, ensure "Show Histogram" is enabled.
• If the EMA overshadows the histogram, tweak the dynamic scale window.
• Customize colors for better visibility on different chart backgrounds
1. Introduction
This indicator combines the histogram of (Close – Open) divided by volume with a dynamically scaled EMA of net volume. It helps identify the strength of price movements tied to buying vs. selling volume.
2. Input Parameters
Show Histogram (ΔPrice/Vol): Enable or disable the (Close - Open) / Volume histogram.
Histogram Up Color: Color for positive histogram bars.
Histogram Down Color: Color for negative histogram bars.
Histogram Zero Color: Color for zero-value histogram bars.
Show EMA NetVolume: Enable or disable the net volume EMA line.
EMA NetVolume Period: Number of bars for the net volume EMA calculation.
EMA Up Color: Color for the EMA when net volume is positive.
EMA Down Color: Color for the EMA when net volume is negative.
EMA Line Width: Thickness of the EMA line.
Dynamic Scale Window: Number of bars for calculating the EMA scaling factor.
3. Visualization and Interpretation
• The histogram displays (Close – Open) / Volume, colored by candle direction.
• The net volume EMA shows accumulated buying vs. selling volume.
• EMA above zero indicates buying dominance; below zero indicates selling dominance.
• Both series share the same zero line for easy comparison.
4. Examples of Use
• During a strong uptrend, expect large green histogram bars and the EMA in positive territory.
• In a retracement, red histogram bars appear more frequently and the EMA may cross below zero.
• Adjust the dynamic scale window to fine-tune EMA sensitivity.
5. Troubleshooting
• If you do not see the histogram, ensure "Show Histogram" is enabled.
• If the EMA overshadows the histogram, tweak the dynamic scale window.
• Customize colors for better visibility on different chart backgrounds
Open-source script
In true TradingView spirit, the creator of this script has made it open-source, so that traders can review and verify its functionality. Kudos to the author! While you can use it for free, remember that republishing the code is subject to our House Rules.
Disclaimer
The information and publications are not meant to be, and do not constitute, financial, investment, trading, or other types of advice or recommendations supplied or endorsed by TradingView. Read more in the Terms of Use.