OPEN-SOURCE SCRIPT
Buffett Indicator with Historical Bubbles (Clean)
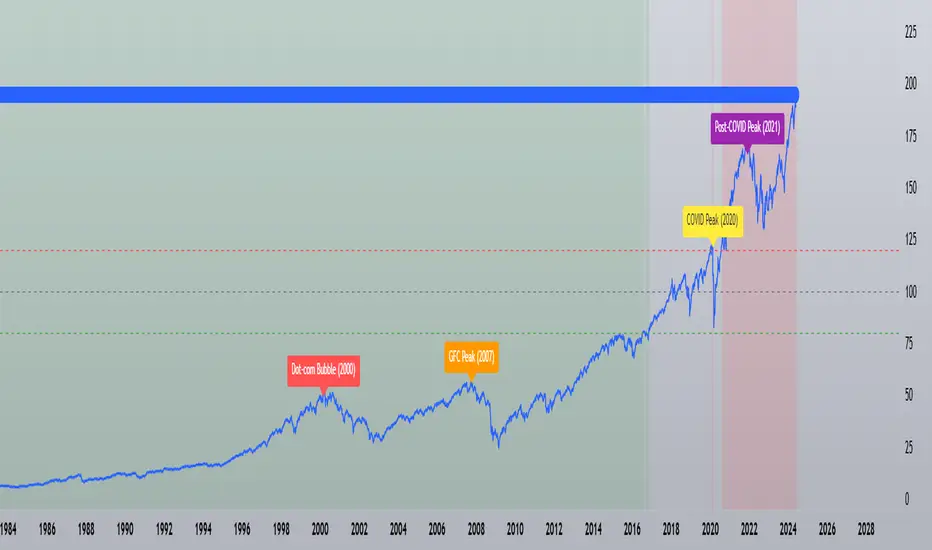
The Buffett Indicator is a trusted macroeconomic gauge that compares the total US stock market capitalization to the nation’s GDP. Popularized by Warren Buffett, this metric highlights periods of overvaluation and undervaluation in the market.
This tool offers a clean and accurate visualization of the Buffett Indicator, enhanced with historical bubble annotations for key market events:
Dot-com Bubble (2000)
Global Financial Crisis Peak (2007)
COVID-19 Pre-crash Peak (2020)
Post-COVID Bull Market Peak (2021)
Features:
Dynamic Buffett Ratio (%) calculation using Wilshire 5000 Index as the market cap proxy.
Customizable GDP input for accuracy (update quarterly).
Visual thresholds for fair value, undervaluation, and overvaluation zones.
Historical event markers for educational and analytical context.
Optimized to display clearly across all timeframes: Daily, Weekly, Monthly.
How to Use:
Manually update the GDP input as new data is released.
Use this indicator for macro-level market sentiment analysis and valuation tracking.
Combine with other tools and risk management strategies for comprehensive market insights.
Disclaimer:
This indicator is for educational purposes only. It does not constitute financial advice. Always perform your own research and analysis.
Version: 1.0
we ask Allah reconcile and repay
#BuffettIndicator #MarketValuation #MacroAnalysis #BubbleDetector #LongTermInvestor #USMarket #Wilshire5000 #TradingViewScript
Open-source script
In true TradingView spirit, the creator of this script has made it open-source, so that traders can review and verify its functionality. Kudos to the author! While you can use it for free, remember that republishing the code is subject to our House Rules.
👋 Be a trader, not a gambler, by following risk/capital management!!
🎉Get Your Discount Today! (Limited offer)
t.me/PCS_Signals_Results/8448
We ask Allah reconcile and repay ❤️🙏
🎉Get Your Discount Today! (Limited offer)
t.me/PCS_Signals_Results/8448
We ask Allah reconcile and repay ❤️🙏
Disclaimer
The information and publications are not meant to be, and do not constitute, financial, investment, trading, or other types of advice or recommendations supplied or endorsed by TradingView. Read more in the Terms of Use.