OPEN-SOURCE SCRIPT
Updated Supply and Demand Zones
🔍 Supply and Demand Zones
by The_Forex_Steward
This indicator automatically identifies Supply and Demand Zones based on aggregated synthetic candles, helping traders pinpoint potential reversal or breakout levels with clarity and precision.
🧠 How It Works:
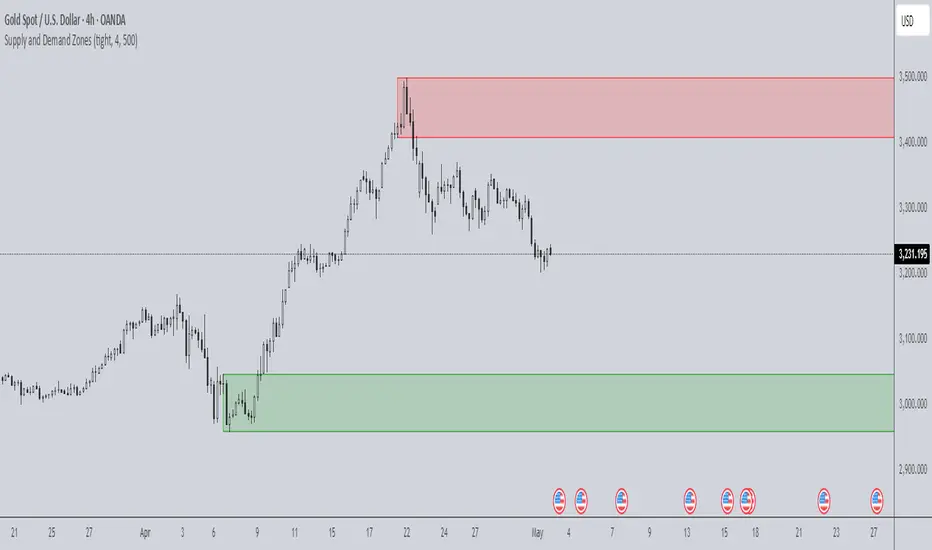
This tool aggregates price data over a set number of candles (defined by the Aggregation Factor) to create "synthetic candles" that smooth out noise and highlight significant institutional price activity. These candles are then analyzed to detect bullish or bearish order blocks, which are visualized as zones:
-Demand Zones (Green): Formed when price breaks above the high of a previous bearish synthetic candle.
-Supply Zones (Red): Formed when price breaks below the low of a previous bullish synthetic candle.
These areas often represent key institutional interest where price is likely to react.
⚙️ Key Features:
-Aggregation Factor: Groups candles to form larger, synthetic ones. Higher values smooth price and reduce noise.
-Custom Zone Length: Define how far zones extend forward (up to 500 bars).
-Mitigation Logic: Choose whether to auto-delete zones once price breaks through them.
-Visual Customization: Customize zone colors and borders to suit your charting style.
-Alerts: Get notified when new Supply or Demand zones are formed.
📈 How to Use It:
1. Trend Trading: Use zones as dynamic support/resistance to enter with trend pullbacks.
2. Reversals: Look for price reactions at untested zones for potential counter-trend setups.
3. Breakouts: Monitor for zone breaks that signal strong momentum or shifts in market structure.
4. Confluence: Combine with other indicators (like RSI or volume) for more robust trade setups.
🔔 Alerts:
Receive alerts when new demand or supply zones are formed so you can take action in real time.
✅ Recommended Settings:
For intraday trading: Use lower aggregation values (e.g., 3–5).
For swing/position trading: Higher values (e.g., 6–10) may give better structure.
by The_Forex_Steward
This indicator automatically identifies Supply and Demand Zones based on aggregated synthetic candles, helping traders pinpoint potential reversal or breakout levels with clarity and precision.
🧠 How It Works:
This tool aggregates price data over a set number of candles (defined by the Aggregation Factor) to create "synthetic candles" that smooth out noise and highlight significant institutional price activity. These candles are then analyzed to detect bullish or bearish order blocks, which are visualized as zones:
-Demand Zones (Green): Formed when price breaks above the high of a previous bearish synthetic candle.
-Supply Zones (Red): Formed when price breaks below the low of a previous bullish synthetic candle.
These areas often represent key institutional interest where price is likely to react.
⚙️ Key Features:
-Aggregation Factor: Groups candles to form larger, synthetic ones. Higher values smooth price and reduce noise.
-Custom Zone Length: Define how far zones extend forward (up to 500 bars).
-Mitigation Logic: Choose whether to auto-delete zones once price breaks through them.
-Visual Customization: Customize zone colors and borders to suit your charting style.
-Alerts: Get notified when new Supply or Demand zones are formed.
📈 How to Use It:
1. Trend Trading: Use zones as dynamic support/resistance to enter with trend pullbacks.
2. Reversals: Look for price reactions at untested zones for potential counter-trend setups.
3. Breakouts: Monitor for zone breaks that signal strong momentum or shifts in market structure.
4. Confluence: Combine with other indicators (like RSI or volume) for more robust trade setups.
🔔 Alerts:
Receive alerts when new demand or supply zones are formed so you can take action in real time.
✅ Recommended Settings:
For intraday trading: Use lower aggregation values (e.g., 3–5).
For swing/position trading: Higher values (e.g., 6–10) may give better structure.
Release Notes
Updated chart exampleRelease Notes
Two modes available (tight vs broad)Release Notes
Calculation logic improved.Release Notes
Terminology updatedRelease Notes
Updated box shadingRelease Notes
Calculation logic fixRelease Notes
Alert updateRelease Notes
User can now customize colors of zonesOpen-source script
In true TradingView spirit, the creator of this script has made it open-source, so that traders can review and verify its functionality. Kudos to the author! While you can use it for free, remember that republishing the code is subject to our House Rules.
Disclaimer
The information and publications are not meant to be, and do not constitute, financial, investment, trading, or other types of advice or recommendations supplied or endorsed by TradingView. Read more in the Terms of Use.
Open-source script
In true TradingView spirit, the creator of this script has made it open-source, so that traders can review and verify its functionality. Kudos to the author! While you can use it for free, remember that republishing the code is subject to our House Rules.
Disclaimer
The information and publications are not meant to be, and do not constitute, financial, investment, trading, or other types of advice or recommendations supplied or endorsed by TradingView. Read more in the Terms of Use.