OPEN-SOURCE SCRIPT
Updated Donchian Range, RSI, and Levels System
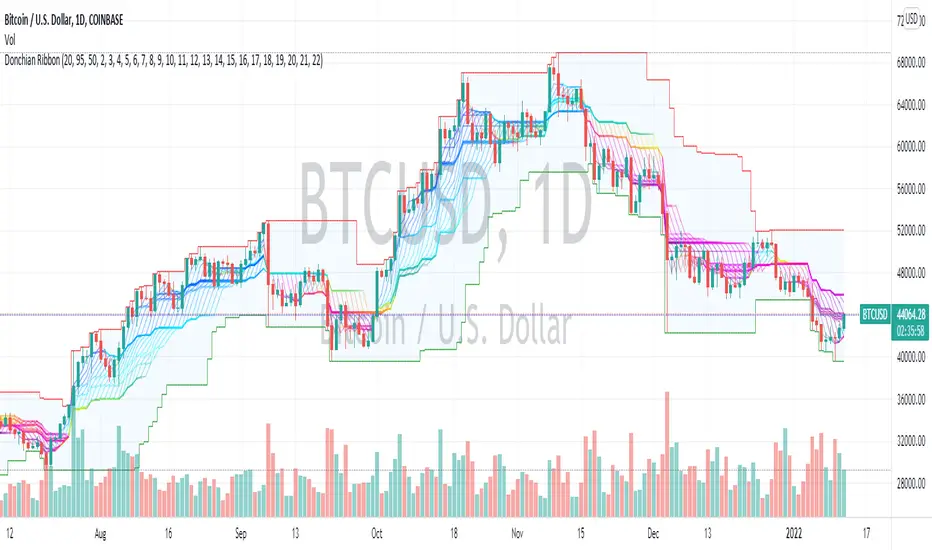
The Donchian average is defined as average(highest, lowest) for a given period length. By plotting many different lengths, clustering of the lines seems to form natural support/resistance levels. A Donchian Channel and RSI rainbow colors are also provided to define the range and trend.
Release Notes
updated default viewsOpen-source script
In true TradingView spirit, the creator of this script has made it open-source, so that traders can review and verify its functionality. Kudos to the author! While you can use it for free, remember that republishing the code is subject to our House Rules.
Disclaimer
The information and publications are not meant to be, and do not constitute, financial, investment, trading, or other types of advice or recommendations supplied or endorsed by TradingView. Read more in the Terms of Use.
Open-source script
In true TradingView spirit, the creator of this script has made it open-source, so that traders can review and verify its functionality. Kudos to the author! While you can use it for free, remember that republishing the code is subject to our House Rules.
Disclaimer
The information and publications are not meant to be, and do not constitute, financial, investment, trading, or other types of advice or recommendations supplied or endorsed by TradingView. Read more in the Terms of Use.