OPEN-SOURCE SCRIPT
Updated SPX and Federal Net Liquidity difference
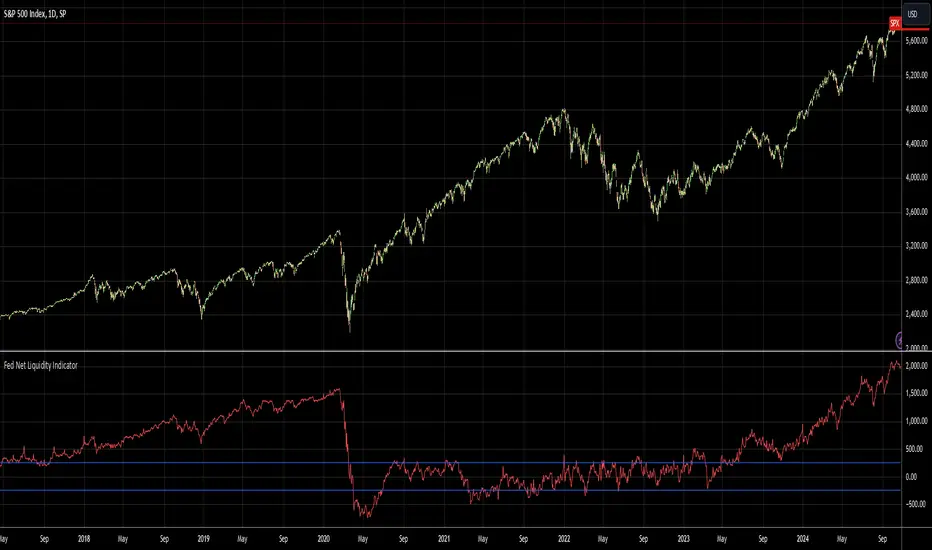
Script for applying Federal Net Liquidity to the SPX post-2020 monetary policy. Original indicator from jlb05013 with adjustments to make it more readable and usable. When the indicator is above 250 the SPX is overbought and when it's below -250 the SPX is oversold.
It's not perfect, I'm just publishing because I didn't see it already out there.
It's not perfect, I'm just publishing because I didn't see it already out there.
Release Notes
TradingView was bringing in the variables with different units. Fixed that and removed unnecessary code.Release Notes
Reconnected FRED dataset for Federal Balance Sheet. The quandl dataset was not working anymore.Indicator now clearly shows either a) a strong over-valuation in the market or b) the indicator no longer applies
Release Notes
Updated to plot SPX within the chart so it is a complete chart regardless of which symbol you have on the main pane.Release Notes
Changed chart in published versionOpen-source script
In true TradingView spirit, the creator of this script has made it open-source, so that traders can review and verify its functionality. Kudos to the author! While you can use it for free, remember that republishing the code is subject to our House Rules.
Disclaimer
The information and publications are not meant to be, and do not constitute, financial, investment, trading, or other types of advice or recommendations supplied or endorsed by TradingView. Read more in the Terms of Use.
Open-source script
In true TradingView spirit, the creator of this script has made it open-source, so that traders can review and verify its functionality. Kudos to the author! While you can use it for free, remember that republishing the code is subject to our House Rules.
Disclaimer
The information and publications are not meant to be, and do not constitute, financial, investment, trading, or other types of advice or recommendations supplied or endorsed by TradingView. Read more in the Terms of Use.