OPEN-SOURCE SCRIPT
Updated Rate Of Change Earnings Move - ROCEM
Rate Of Change Earnings Move
What is it and how does it work?
The Rate of Change Earnings Move indicator or ROCEM is an indicator designed for giving the user an idea of how much a stock has moved up or down in past earnings reports. This is ideal for options traders who can use ROCEM to calculate whether or not their long straddles are actually probable of happening.
How it works
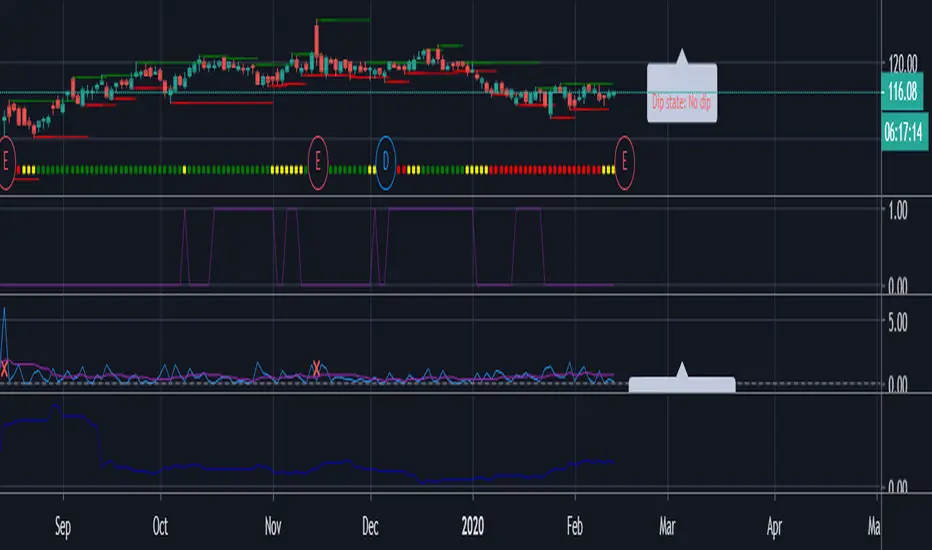
The indicator measures the absolute value rate of change and then calculates the average rate of change for the day of the earnings report for the past 8 earnings reports (2 years). It then takes the current stock price and finds the upper and lower price based on the average rate of change for past earnings.
I have also included a moving average (purple line), use this to see if the current rate of change is higher than usual.
Additionally, earnings reports are marked with a red x on the indicator.
How to trade ROCEM
This is primarily made for options trading so I will be explaining how it can be used for that. It is not suited for traditional stock trading as it does not determine a market direction.
What is it and how does it work?
The Rate of Change Earnings Move indicator or ROCEM is an indicator designed for giving the user an idea of how much a stock has moved up or down in past earnings reports. This is ideal for options traders who can use ROCEM to calculate whether or not their long straddles are actually probable of happening.
How it works
The indicator measures the absolute value rate of change and then calculates the average rate of change for the day of the earnings report for the past 8 earnings reports (2 years). It then takes the current stock price and finds the upper and lower price based on the average rate of change for past earnings.
I have also included a moving average (purple line), use this to see if the current rate of change is higher than usual.
Additionally, earnings reports are marked with a red x on the indicator.
How to trade ROCEM
This is primarily made for options trading so I will be explaining how it can be used for that. It is not suited for traditional stock trading as it does not determine a market direction.
- Select a stock with an upcoming earnings
- Enter your per leg commissions in the indicator if you want it to calculate new upper and lower prices (makes it easier to determine if the options trade will pass the breakeven when commissions are factored in)
- Compare your long straddle breakevens with the upper and lower prices of the indicator. If the upper breakeven is smaller than the upper price in ROCEM and the lower breakeven is larger than the lower price in ROCEM, then a long straddle position could be considered a reasonable trade based on past earnings performance.
Release Notes
Added total spread calculation and fixed a new pine script errorOpen-source script
In true TradingView spirit, the creator of this script has made it open-source, so that traders can review and verify its functionality. Kudos to the author! While you can use it for free, remember that republishing the code is subject to our House Rules.
Disclaimer
The information and publications are not meant to be, and do not constitute, financial, investment, trading, or other types of advice or recommendations supplied or endorsed by TradingView. Read more in the Terms of Use.
Open-source script
In true TradingView spirit, the creator of this script has made it open-source, so that traders can review and verify its functionality. Kudos to the author! While you can use it for free, remember that republishing the code is subject to our House Rules.
Disclaimer
The information and publications are not meant to be, and do not constitute, financial, investment, trading, or other types of advice or recommendations supplied or endorsed by TradingView. Read more in the Terms of Use.