OPEN-SOURCE SCRIPT
Relative Standard Deviation
Standard Deviation is a common measure of volatility (the dispersion of data relative to its mean). However, when using it as an indicator, it can be more useful at times to know the deviation relative to the price as a percentage versus the hard value. This normalizes the data so that it is easier to compare the deviation of different assets. By definition, standard deviation is the square root of the variance, and it is how far the price is from the mean 68.2% of the time when there is normative distribution.
What it does: This indicator will tell you the standard deviation of the asset relative to its price (as a %), but also has the option to plot the normal (population) standard deviation.
Example use case: The regular standard deviation of Asset A is $12 and Asset B is $10. Which one is more volatile? Well, it depends on the asset price. If asset A just closed at $900 and asset B just closed at $30, that makes a big difference. In this instance Asset A $12/$900=1.33% (standard deviation relative to the asset price). Asset B $10/$30=33.33% (standard deviation relative to the asset price). Using a normal standard deviation indicator, you would just see that the standard deviation of Asset A is higher as a hard dollar value, when the reality is that Asset A is much less volatile.
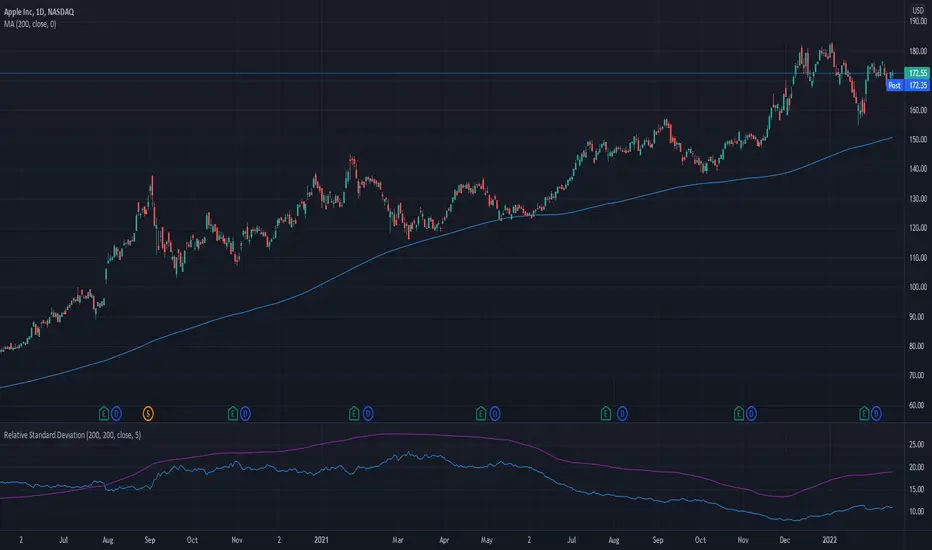
How to use it: This indicator plots a blue line by default that is the Relative Standard Deviation of the asset compared to the asset price (a %). There is also an option to turn on / plot regular (population) Standard Deviation, which will plot as a purple line. The mean length used for the average, and the lookback period that the indicator uses to calculate, are both adjustable with inputs.
What it does: This indicator will tell you the standard deviation of the asset relative to its price (as a %), but also has the option to plot the normal (population) standard deviation.
Example use case: The regular standard deviation of Asset A is $12 and Asset B is $10. Which one is more volatile? Well, it depends on the asset price. If asset A just closed at $900 and asset B just closed at $30, that makes a big difference. In this instance Asset A $12/$900=1.33% (standard deviation relative to the asset price). Asset B $10/$30=33.33% (standard deviation relative to the asset price). Using a normal standard deviation indicator, you would just see that the standard deviation of Asset A is higher as a hard dollar value, when the reality is that Asset A is much less volatile.
How to use it: This indicator plots a blue line by default that is the Relative Standard Deviation of the asset compared to the asset price (a %). There is also an option to turn on / plot regular (population) Standard Deviation, which will plot as a purple line. The mean length used for the average, and the lookback period that the indicator uses to calculate, are both adjustable with inputs.
Open-source script
In true TradingView spirit, the creator of this script has made it open-source, so that traders can review and verify its functionality. Kudos to the author! While you can use it for free, remember that republishing the code is subject to our House Rules.
Disclaimer
The information and publications are not meant to be, and do not constitute, financial, investment, trading, or other types of advice or recommendations supplied or endorsed by TradingView. Read more in the Terms of Use.