OPEN-SOURCE SCRIPT
Updated Faytterro Market Structere
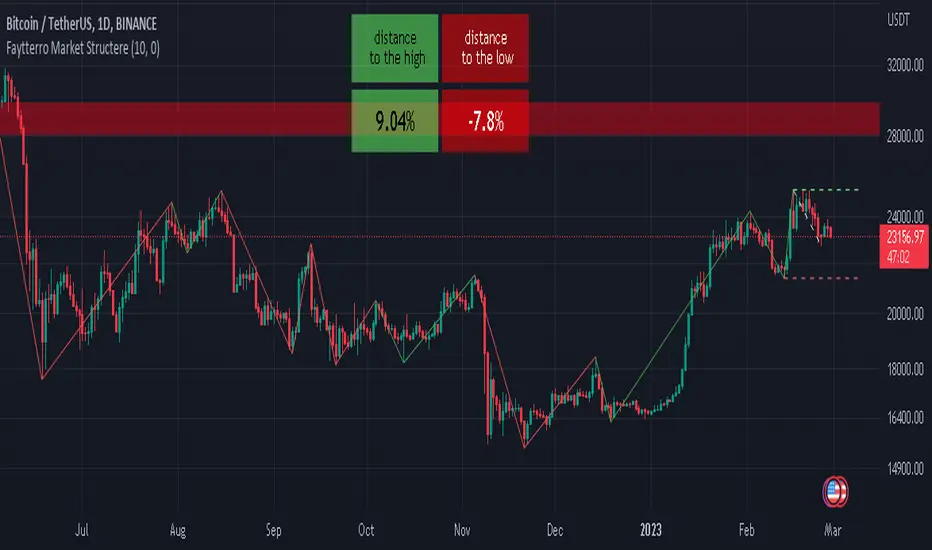
this indicator creates the market structure with a little delay but perfectly. each zigzag is always drawn from highest to lowest. It also signals when the market structure is broken. signals fade over time.
The table above shows the percentage distance of the price from the last high and the last low.
zigzags are painted green when making higher peaks, while lower peaks are considered downtrends and are painted red. In fact, the indicator is quite simple to understand and use.
"length" is used to change the frequency of the signal.
"go to past" is used to see historical data.
Please review the examples:
Release Notes
it draws earlier now.Release Notes
changed the ''max_bars_back'' to 2000.Release Notes
bugs fixed.Open-source script
In true TradingView spirit, the creator of this script has made it open-source, so that traders can review and verify its functionality. Kudos to the author! While you can use it for free, remember that republishing the code is subject to our House Rules.
Disclaimer
The information and publications are not meant to be, and do not constitute, financial, investment, trading, or other types of advice or recommendations supplied or endorsed by TradingView. Read more in the Terms of Use.
Open-source script
In true TradingView spirit, the creator of this script has made it open-source, so that traders can review and verify its functionality. Kudos to the author! While you can use it for free, remember that republishing the code is subject to our House Rules.
Disclaimer
The information and publications are not meant to be, and do not constitute, financial, investment, trading, or other types of advice or recommendations supplied or endorsed by TradingView. Read more in the Terms of Use.