OPEN-SOURCE SCRIPT
Updated True ATH/ATL w/ labels
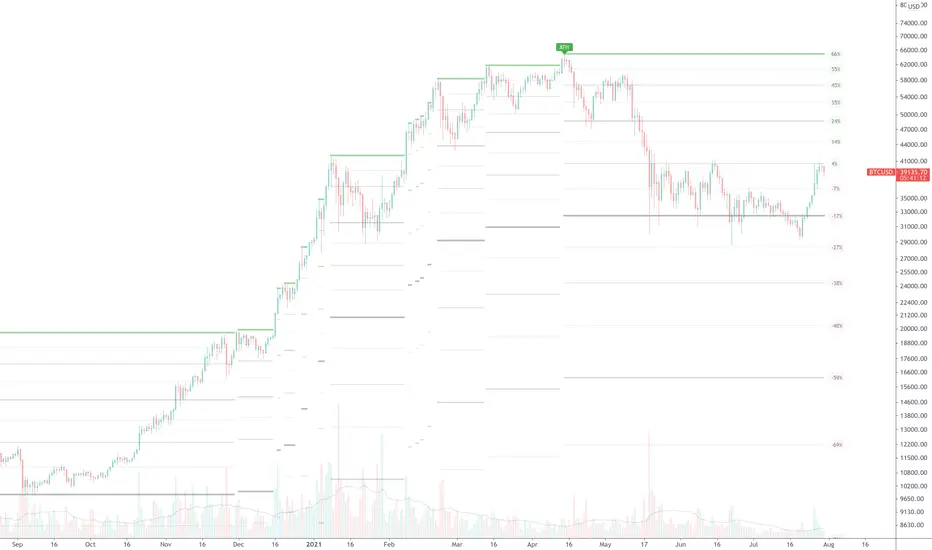
Plots the All Time High and All Time Low, with optional labels when a new ATH/ATL is created. Reaches all the way back in history for the true high/low, not limited to the most recent 5000 candles like most scripts. Works on all time frames.
Release Notes
- Show distance in percent from current price.
- Draw dividing lines between ATH and ATL.
The optional dividing lines provide good support and resistance targets. Works on all time frames and instruments, but particularly rangy stocks.
Release Notes
(Update example chart to remove stray drawings)Open-source script
In true TradingView spirit, the creator of this script has made it open-source, so that traders can review and verify its functionality. Kudos to the author! While you can use it for free, remember that republishing the code is subject to our House Rules.
Disclaimer
The information and publications are not meant to be, and do not constitute, financial, investment, trading, or other types of advice or recommendations supplied or endorsed by TradingView. Read more in the Terms of Use.
Open-source script
In true TradingView spirit, the creator of this script has made it open-source, so that traders can review and verify its functionality. Kudos to the author! While you can use it for free, remember that republishing the code is subject to our House Rules.
Disclaimer
The information and publications are not meant to be, and do not constitute, financial, investment, trading, or other types of advice or recommendations supplied or endorsed by TradingView. Read more in the Terms of Use.