OPEN-SOURCE SCRIPT
Updated Double RSI For Kate
Double RSI for scalping and trend recognition. Green for longs, red for shorts. Based on close. ;)
Release Notes
Scalping filter double RSI with color change for bull bear. :)Release Notes
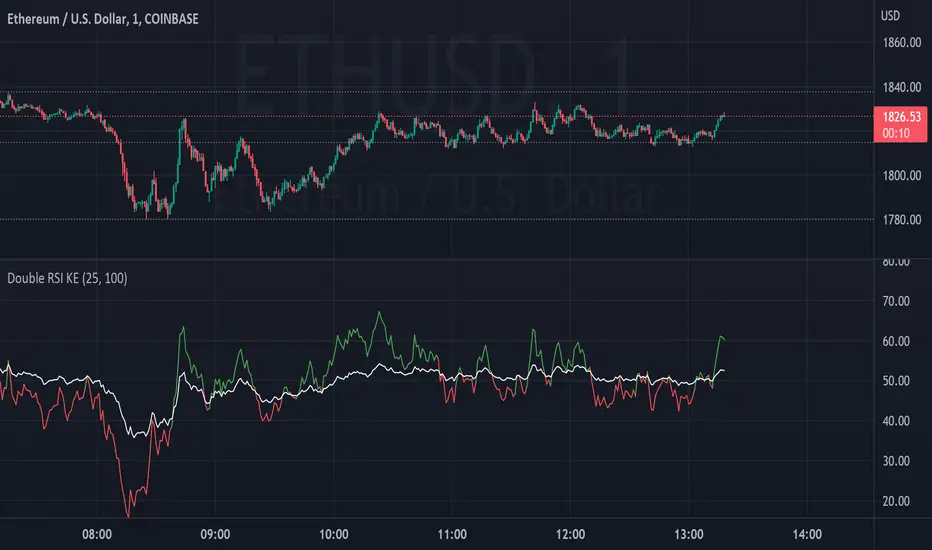
Double RSI KE Indicator: Enhanced Trend Detection Made SimpleThe Double RSI KE Indicator is a straightforward yet effective tool designed to enhance trend detection and improve trading decision-making. By combining two RSI (Relative Strength Index) calculations with different periods, this indicator provides a clearer view of momentum shifts and trend strength.
📊 How It Works:
The indicator calculates two separate RSIs:
RSI1: A faster, more sensitive RSI with a default period of 25 (user-adjustable).
RSI2: A slower, smoother RSI with a default period of 100 (user-adjustable).
The tool plots RSI1 and RSI2 on the same chart, using colors to indicate momentum shifts:
Green: RSI1 is above RSI2, suggesting bullish momentum.
Red: RSI1 is below RSI2, suggesting bearish momentum.
White Line: RSI2, serving as a baseline or trend filter.
💡 Why It’s Useful:
✅ Improved Trend Clarity: By comparing a fast and slow RSI, you can quickly determine whether short-term momentum aligns with the overall trend.
✅ Versatility: Works across various timeframes and markets, including stocks, forex, crypto, and commodities.
✅ Simple Yet Effective: Provides clear visual signals for trend-following and potential reversals.
📌 How To Use It Effectively:
Trend Confirmation: When RSI1 (green) stays above RSI2 (white), it indicates a bullish trend.
Reversal Detection: When RSI1 (red) crosses below RSI2, it signals a potential bearish reversal.
Customization: Adjust RSI1 and RSI2 periods to suit your trading strategy and timeframe.
The Double RSI KE Indicator is a simple, customizable tool that can enhance your ability to spot trends and reversals with precision. Perfect for traders looking to simplify their analysis without sacrificing reliability. 🚀
⚠️ Disclaimer:
The GTC Double RSI KE is a powerful tool designed to enhance your market analysis by providing real-time insights on market shifts. However, it is not a replacement for comprehensive market analysis or prudent risk management. Always combine this tool with thorough research, technical analysis, and a well-structured trading plan. Past performance is not indicative of future results. Trade responsibly.
Release Notes
Hey everyone! Thanks for checking out the GTC Breakout Scanner. I love making new scripts to help refine the trading process. If you would like access to my brightest ideas, click the link below!
gordontradingco.gumroad.com/l/kzjpt?_gl=1*mqk00
Double RSI KE Indicator: Enhanced Trend Detection Made Simple
The Double RSI KE Indicator is a straightforward yet effective tool designed to enhance trend detection and improve trading decision-making. By combining two RSI (Relative Strength Index) calculations with different periods, this indicator provides a clearer view of momentum shifts and trend strength.
📊 How It Works:
The indicator calculates two separate RSIs:
RSI1: A faster, more sensitive RSI with a default period of 25 (user-adjustable).
RSI2: A slower, smoother RSI with a default period of 100 (user-adjustable).
The tool plots RSI1 and RSI2 on the same chart, using colors to indicate momentum shifts:
Green: RSI1 is above RSI2, suggesting bullish momentum.
Red: RSI1 is below RSI2, suggesting bearish momentum.
White Line: RSI2, serving as a baseline or trend filter.
💡 Why It’s Useful:
✅ Improved Trend Clarity: By comparing a fast and slow RSI, you can quickly determine whether short-term momentum aligns with the overall trend.
✅ Versatility: Works across various timeframes and markets, including stocks, forex, crypto, and commodities.
✅ Simple Yet Effective: Provides clear visual signals for trend-following and potential reversals.
📌 How To Use It Effectively:
Trend Confirmation: When RSI1 (green) stays above RSI2 (white), it indicates a bullish trend.
Reversal Detection: When RSI1 (red) crosses below RSI2, it signals a potential bearish reversal.
Customization: Adjust RSI1 and RSI2 periods to suit your trading strategy and timeframe.
The Double RSI KE Indicator is a simple, customizable tool that can enhance your ability to spot trends and reversals with precision. Perfect for traders looking to simplify their analysis without sacrificing reliability. 🚀
⚠️ Disclaimer:
The GTC Double RSI KE is a powerful tool designed to enhance your market analysis by providing real-time insights on market shifts. However, it is not a replacement for comprehensive market analysis or prudent risk management. Always combine this tool with thorough research, technical analysis, and a well-structured trading plan. Past performance is not indicative of future results. Trade responsibly.
Open-source script
In true TradingView spirit, the creator of this script has made it open-source, so that traders can review and verify its functionality. Kudos to the author! While you can use it for free, remember that republishing the code is subject to our House Rules.
Disclaimer
The information and publications are not meant to be, and do not constitute, financial, investment, trading, or other types of advice or recommendations supplied or endorsed by TradingView. Read more in the Terms of Use.