OPEN-SOURCE SCRIPT
Price Deviation from SMA/EMA with % Threshold Highlight
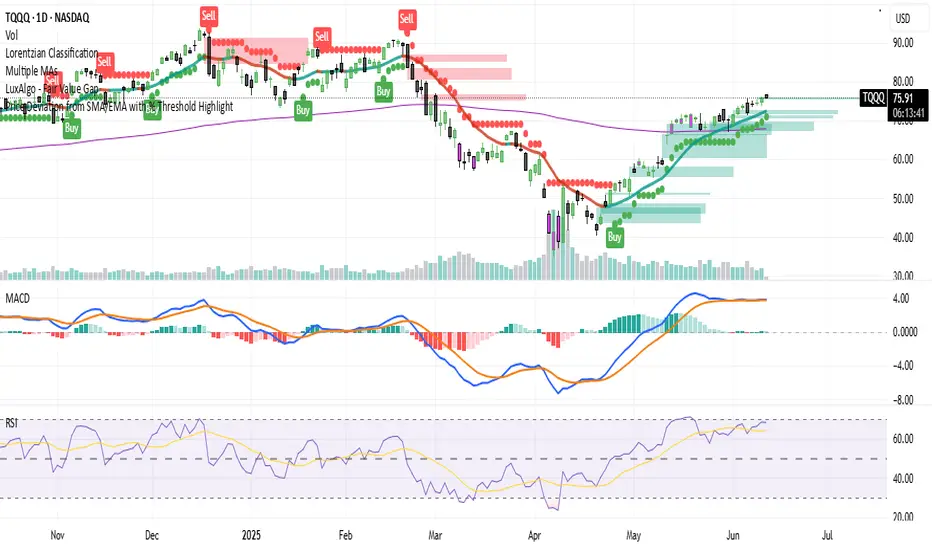
Select between SMA or EMA.
Adjustable length (default is 20).
Visual deviation band from price.
Plot of absolute deviation on a separate line.
Adding a threshold input. The threshold input is in percentage (%), e.g., 2.5 means 2.5% deviation. The deviation is compared to ma * (thresholdPercent / 100).
Highlights bars where the absolute deviation exceeds the percentage of the MA value.
Highlighting bars where the absolute deviation from the moving average exceeds the threshold.
If thresholdPct = 2.0 and the EMA is 100, then the deviation threshold is 2.0, and bars with absolute deviation > 2.0 will be highlighted.
You can set the threshold manually as a parameter.
The bars will be highlighted (colored) when deviation is outside the threshold range.
The threshold lets you define a "normal" deviation range. Any bars outside of this range are potential outliers — and are now visually flagged.
Open-source script
In true TradingView spirit, the creator of this script has made it open-source, so that traders can review and verify its functionality. Kudos to the author! While you can use it for free, remember that republishing the code is subject to our House Rules.
Disclaimer
The information and publications are not meant to be, and do not constitute, financial, investment, trading, or other types of advice or recommendations supplied or endorsed by TradingView. Read more in the Terms of Use.