OPEN-SOURCE SCRIPT
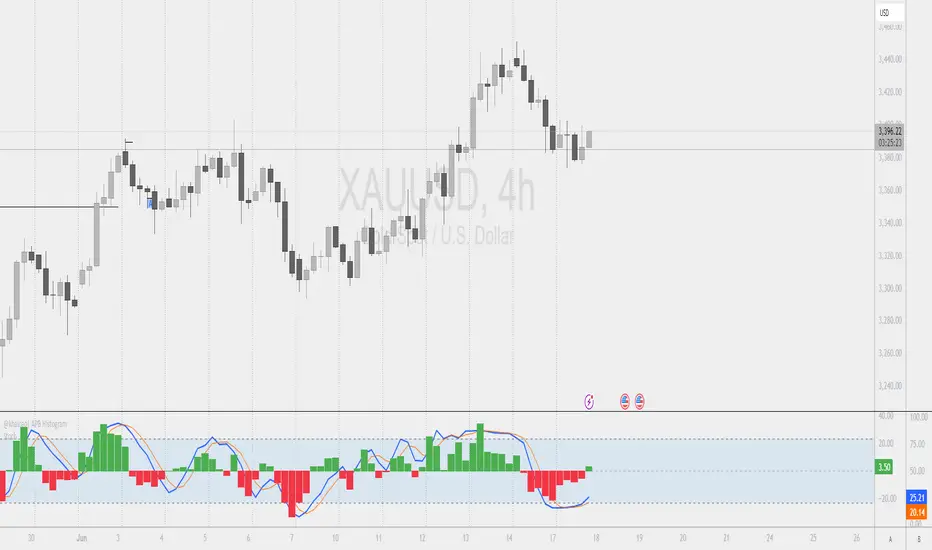
@khaicao| APB Histogram
Introducing the APB Histogram Indicator
A Powerful Tool for Visualizing Price Momentum
The APB Histogram (Average Price Bar Histogram) is a unique and insightful indicator designed to help traders identify price momentum and potential trend reversals. By calculating a smoothed average of price action and plotting the difference between the APB Close and APB Open as a histogram, this indicator provides a clear visual representation of bullish and bearish pressure in the market.
Key Features:
✅ Smoothed Price Calculation – Uses a recursive formula to generate a dynamic average price bar, reducing noise and highlighting meaningful trends.
✅ Intuitive Histogram Display – Positive (green) bars indicate bullish momentum, while negative (red) bars signal bearish momentum.
✅ Customizable Colors – Adjust the bullish and bearish colors to match your trading style.
✅ Non-Overlay Design – Plotted in a separate panel for clear visualization without cluttering the main chart.
How to Use the APB Histogram:
Bullish Signals: When the histogram bars are green and rising, it suggests increasing buying pressure.
Bearish Signals: When the histogram bars are red and falling, it indicates growing selling pressure.
Trend Confirmation: Use alongside other indicators, recommended to use with Stochastic (8,3,3) to confirm trend strength.
Perfect For:
Swing Traders looking for momentum shifts
Day Traders needing quick visual cues on price direction
Trend Followers confirming entry and exit points
Try the APB Histogram today and enhance your trading strategy with a cleaner, more intuitive view of market momentum!
🔹 Like & Follow for more unique indicators!
🔹 Comment below if you have any questions or improvement suggestions!
Happy Trading! 🚀
Open-source script
In true TradingView spirit, the creator of this script has made it open-source, so that traders can review and verify its functionality. Kudos to the author! While you can use it for free, remember that republishing the code is subject to our House Rules.
Disclaimer
The information and publications are not meant to be, and do not constitute, financial, investment, trading, or other types of advice or recommendations supplied or endorsed by TradingView. Read more in the Terms of Use.