OPEN-SOURCE SCRIPT
Z-Score Strategy Backtest
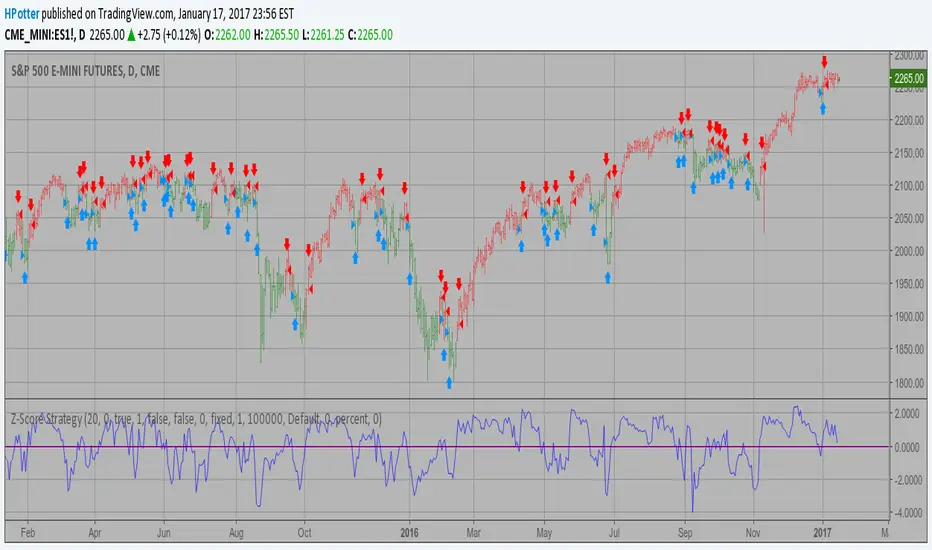
The author of this indicator is Veronique Valcu. The z-score (z) for a data
item x measures the distance (in standard deviations StdDev) and direction
of the item from its mean (U):
z = (x-StdDev) / U
A value of zero indicates that the data item x is equal to the mean U, while
positive or negative values show that the data item is above (x>U) or below
(x Values of +2 and -2 show that the data item is two standard deviations
above or below the chosen mean, respectively, and over 95.5% of all data
items are contained within these two horizontal references (see Figure 1).
We substitute x with the closing price C, the mean U with simple moving
average (SMA) of n periods (n), and StdDev with the standard deviation of
closing prices for n periods, the above formula becomes:
Z_score = (C - SMA(n)) / StdDev(C,n)
The z-score indicator is not new, but its use can be seen as a supplement to
Bollinger bands. It offers a simple way to assess the position of the price
vis-a-vis its resistance and support levels expressed by the Bollinger Bands.
In addition, crossings of z-score averages may signal the start or the end of
a tradable trend. Traders may take a step further and look for stronger signals
by identifying common crossing points of z-score, its average, and average of average.
You can change long to short in the Input Settings
Please, use it only for learning or paper trading. Do not for real trading.
Open-source script
In true TradingView spirit, the creator of this script has made it open-source, so that traders can review and verify its functionality. Kudos to the author! While you can use it for free, remember that republishing the code is subject to our House Rules.
Disclaimer
The information and publications are not meant to be, and do not constitute, financial, investment, trading, or other types of advice or recommendations supplied or endorsed by TradingView. Read more in the Terms of Use.