OPEN-SOURCE SCRIPT
RSI & MFI Candle Color tohungmc tik
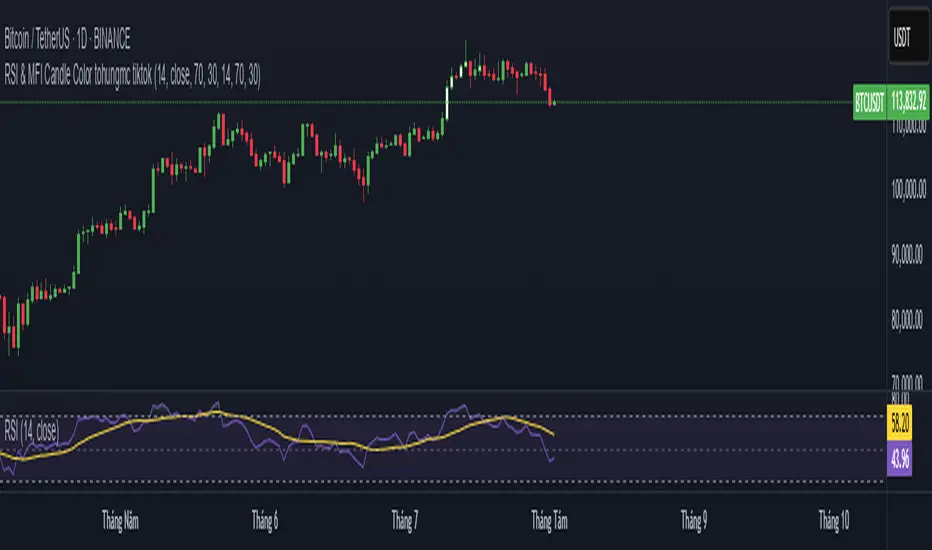
RSI & MFI Candle Color with Alerts is a visual momentum indicator that highlights overbought and oversold conditions directly on your chart using candle colors.
This script combines the Relative Strength Index (RSI) and the Money Flow Index (MFI) with flexible settings, allowing you to:
✅ Display candle color based on RSI
✅ Display candle color based on MFI
✅ Show only candles where both RSI and MFI agree (for stronger signals)
✅ Customize overbought and oversold thresholds
✅ Receive real-time alerts when conditions are met at candle close
Color Logic:
White candles = Overbought (above threshold)
Blue candles = Oversold (below threshold)
Use case:
This tool is useful for traders who want quick, visual confirmation of momentum extremes, and who may combine RSI and MFI for higher accuracy.
Tip: Use with hidden candles (turn off price candles) or overlay it on price action for enhanced visibility.
Open-source script
In true TradingView spirit, the creator of this script has made it open-source, so that traders can review and verify its functionality. Kudos to the author! While you can use it for free, remember that republishing the code is subject to our House Rules.
Disclaimer
The information and publications are not meant to be, and do not constitute, financial, investment, trading, or other types of advice or recommendations supplied or endorsed by TradingView. Read more in the Terms of Use.