OPEN-SOURCE SCRIPT
Psych Level
What it shows:
This indicator will show a horizontal line at a psychological value which can be user defined. (Psychological values are round numbers, like 10,50,100,1000 and so on...)
At these Psychological value there are often limit orders placed for both buying and selling and can often act as support and resistances.
Therefore it is useful to pre-draw these levels beforehand and this indicator will speed up the process doing so by adjusting few different settings and draw them automatically.
How to use it:
At these Psychological value there are often limit orders placed for both buying and selling and can often act as support and resistances. This is often the case when you look at limit orders at such levels on bookmap or level 2 data.
At these psychological levels it can be set as a target of your trade or as risk levels when taking a trade in either of direction. Obviously this alone shouldn't dictate the trade you should take but can be a valuable info to supplement your trade.
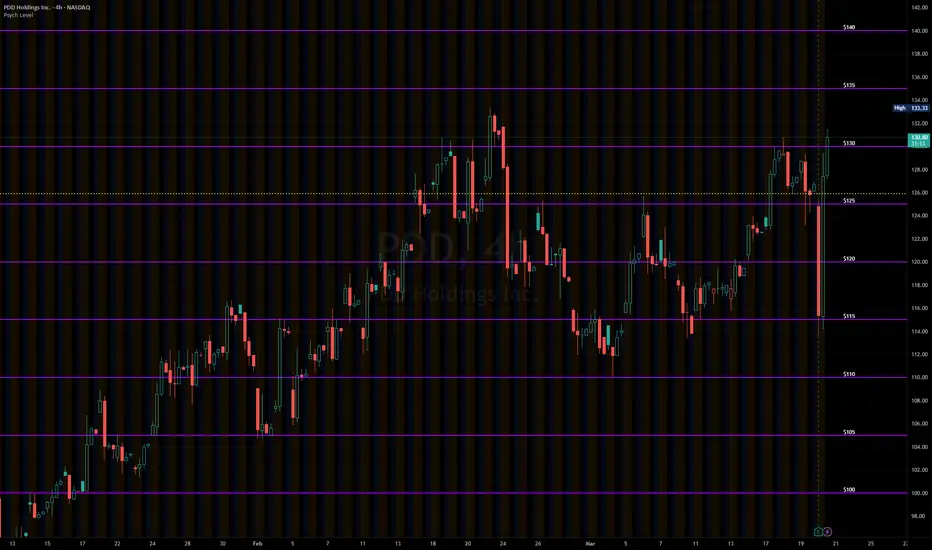
On the chart it is clear to see these psychological level lines are acting as resistances/supports.
Key settings:
Interval: Interval levels will be drawn for, between the minimum and maximum values inputted by the user. Minimum value allowed is 1.
Min. value: Minimum value of Psychological level that will be drawn. Minimum value allowed is 1.
Max value: Maximum value of Psychological level that will be drawn. Minimum value allowed is 1.
Line colour: Colour of line drawn.
Line width: Width of line drawn.
Line style: Style of line drawn, either solid, dotted or dashed.
Label offset: Offset of where where label will be, measured from current bar. Offset of 0 will be drawn at current bar location, any positive number will move to the right by the set amount.
Text Colour: Colour of label text
Text size: Size of label text
Example: Chart here shows setting for minimum value as 100, maximum value as 140 and interval as 5. In this setting lines will be automatically drawn at: 100,105,110,115,120,125,130,145 and 140.
The flexibility of user defined max/min and interval values allows to be accommodated for price with different price tags, including stocks under $10.
----------------------------------------------------------------------
If anything is not clear please let me know!
This indicator will show a horizontal line at a psychological value which can be user defined. (Psychological values are round numbers, like 10,50,100,1000 and so on...)
At these Psychological value there are often limit orders placed for both buying and selling and can often act as support and resistances.
Therefore it is useful to pre-draw these levels beforehand and this indicator will speed up the process doing so by adjusting few different settings and draw them automatically.
How to use it:
At these Psychological value there are often limit orders placed for both buying and selling and can often act as support and resistances. This is often the case when you look at limit orders at such levels on bookmap or level 2 data.
At these psychological levels it can be set as a target of your trade or as risk levels when taking a trade in either of direction. Obviously this alone shouldn't dictate the trade you should take but can be a valuable info to supplement your trade.
On the chart it is clear to see these psychological level lines are acting as resistances/supports.
Key settings:
Interval: Interval levels will be drawn for, between the minimum and maximum values inputted by the user. Minimum value allowed is 1.
Min. value: Minimum value of Psychological level that will be drawn. Minimum value allowed is 1.
Max value: Maximum value of Psychological level that will be drawn. Minimum value allowed is 1.
Line colour: Colour of line drawn.
Line width: Width of line drawn.
Line style: Style of line drawn, either solid, dotted or dashed.
Label offset: Offset of where where label will be, measured from current bar. Offset of 0 will be drawn at current bar location, any positive number will move to the right by the set amount.
Text Colour: Colour of label text
Text size: Size of label text
Example: Chart here shows setting for minimum value as 100, maximum value as 140 and interval as 5. In this setting lines will be automatically drawn at: 100,105,110,115,120,125,130,145 and 140.
The flexibility of user defined max/min and interval values allows to be accommodated for price with different price tags, including stocks under $10.
----------------------------------------------------------------------
If anything is not clear please let me know!
Open-source script
In true TradingView spirit, the creator of this script has made it open-source, so that traders can review and verify its functionality. Kudos to the author! While you can use it for free, remember that republishing the code is subject to our House Rules.
Disclaimer
The information and publications are not meant to be, and do not constitute, financial, investment, trading, or other types of advice or recommendations supplied or endorsed by TradingView. Read more in the Terms of Use.