OPEN-SOURCE SCRIPT
Volume Spike 20%+
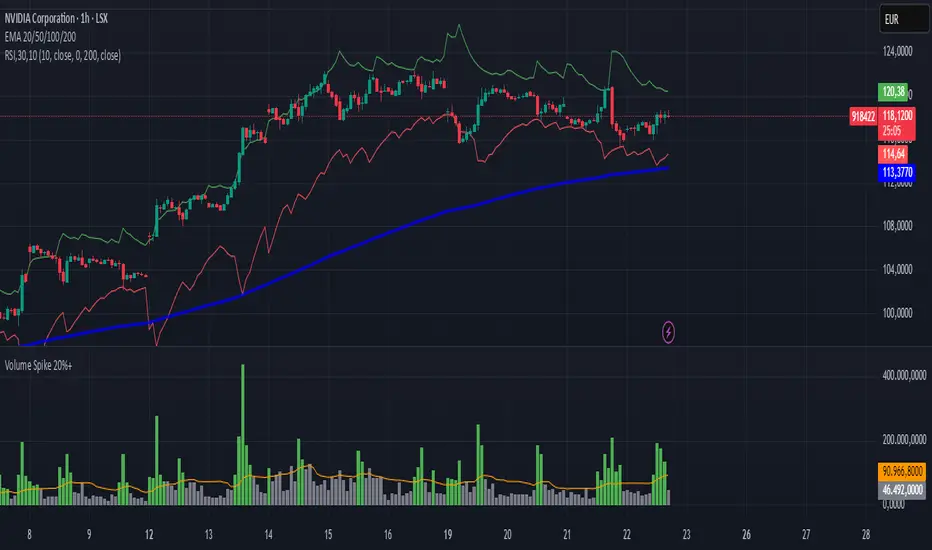
This indicator highlights volume spikes that exceed the 20% threshold above the 20-period simple moving average of volume.
🔹 Gray bars: Normal volume
🔹 Green bars: Volume is at least 20% higher than the 20-period average
🔸 Orange line: The 20-period volume moving average
Use case:
This tool helps traders quickly spot abnormal trading activity or increased interest in a stock, which may precede a price breakout or reversal.
Simple, clean, and effective – perfect for momentum, breakout, or volume-based strategies.
Open-source script
In true TradingView spirit, the creator of this script has made it open-source, so that traders can review and verify its functionality. Kudos to the author! While you can use it for free, remember that republishing the code is subject to our House Rules.
Disclaimer
The information and publications are not meant to be, and do not constitute, financial, investment, trading, or other types of advice or recommendations supplied or endorsed by TradingView. Read more in the Terms of Use.