OPEN-SOURCE SCRIPT
Kairi Relative Index Leading Indicator
Here is a leading indicator based on the relatively obscure Kairi Relative Index. The Kairi comes from Japan and is similar to the popular RSI, although it is believed that it predates the RSI significantly.
The Kairi measures the difference between the current price and its SMA as a percentage of the moving average.
We made a few modifications to the Kairi to improve its timing and balance its sensitivity. First, we calculated a 'fast' and 'slow' Kairi Relative Index. To do this, it calculates the difference between the current price and a SMA with a length of 7 periods for the fast Kairi. Then, the difference between the current price and an SMA of length 24 is calculated for the slow Kairi.
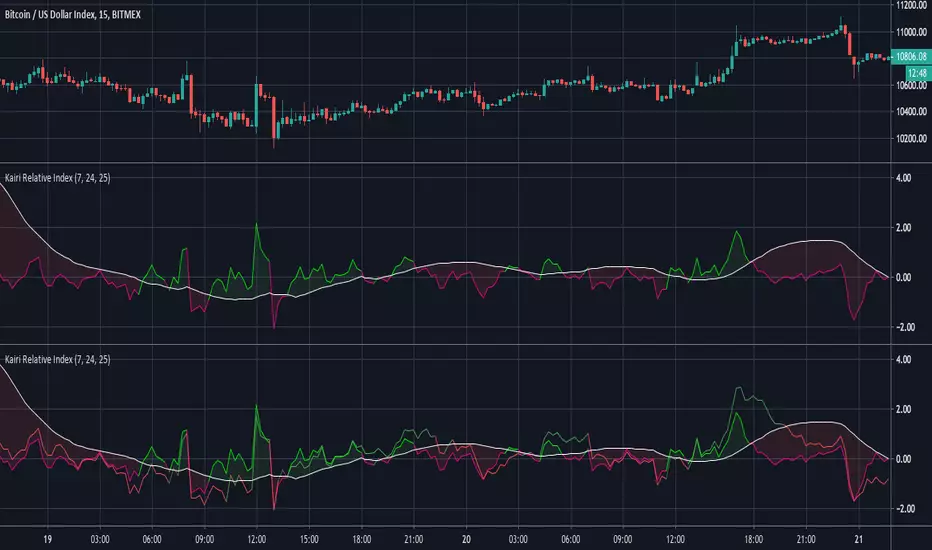
The big modification is using a 25 period SMA of slow Kairi Relative Index values as the threshold for buy and sell signals. When the fast Kairi line crosses above the white line(the threshold) it is considered a bullish signal, while a bearish signal comes when it crosses back below the same white line. This solved the issue with the Kairi having slower reaction time than the RSI. As the chart shows, this setup allowed it to catch not only major trends but also predict unexpected price spikes.
Users can adjust all 3 lengths, as well as adjust the option to have the slow Kairi displayed on the chart(shown in second pane).
The Kairi measures the difference between the current price and its SMA as a percentage of the moving average.
We made a few modifications to the Kairi to improve its timing and balance its sensitivity. First, we calculated a 'fast' and 'slow' Kairi Relative Index. To do this, it calculates the difference between the current price and a SMA with a length of 7 periods for the fast Kairi. Then, the difference between the current price and an SMA of length 24 is calculated for the slow Kairi.
The big modification is using a 25 period SMA of slow Kairi Relative Index values as the threshold for buy and sell signals. When the fast Kairi line crosses above the white line(the threshold) it is considered a bullish signal, while a bearish signal comes when it crosses back below the same white line. This solved the issue with the Kairi having slower reaction time than the RSI. As the chart shows, this setup allowed it to catch not only major trends but also predict unexpected price spikes.
Users can adjust all 3 lengths, as well as adjust the option to have the slow Kairi displayed on the chart(shown in second pane).
Open-source script
In true TradingView spirit, the creator of this script has made it open-source, so that traders can review and verify its functionality. Kudos to the author! While you can use it for free, remember that republishing the code is subject to our House Rules.
-Profit Programmers
profitprogrammer.com
profitprogrammer.com
Disclaimer
The information and publications are not meant to be, and do not constitute, financial, investment, trading, or other types of advice or recommendations supplied or endorsed by TradingView. Read more in the Terms of Use.