OPEN-SOURCE SCRIPT
Enhanced Chaikin Money Flow
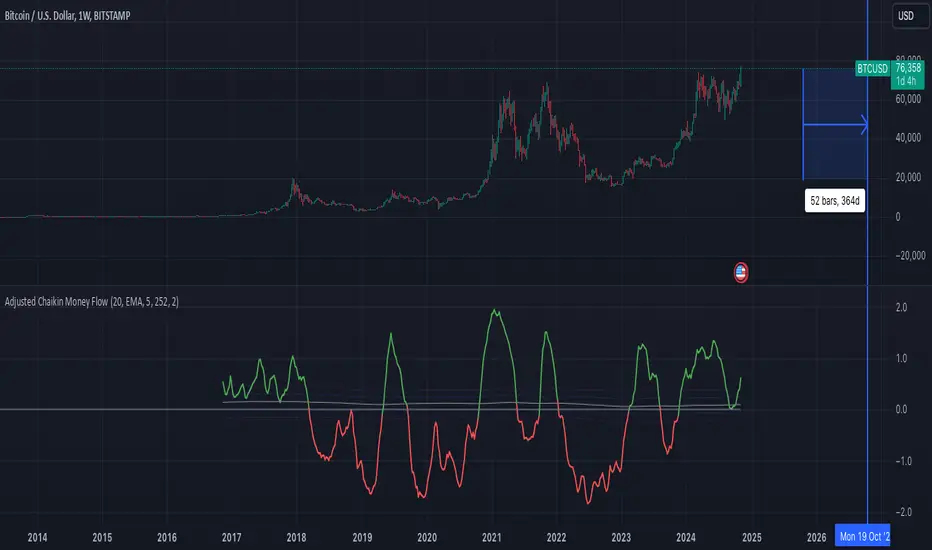
Enhanced Chaikin Money Flow (CMF) with Normalized Distribution
The Enhanced Chaikin Money Flow (CMF) is a sophisticated version of Marc Chaikin's classic volume-weighted indicator that measures buying and selling pressure. This version incorporates statistical normalization and advanced smoothing techniques to provide more reliable signals.
Key Features
Normalized distribution (z-score) for better historical comparison
Multiple smoothing options (SMA, EMA, WMA, RMA) for noise reduction
Standard deviation bands (1σ and 2σ) to identify extreme readings
Adjustable parameters for customization
Alert system for extreme readings
Interpretation
Values represent standard deviations from the mean
Above 0: Indicates net buying pressure
Below 0: Indicates net selling pressure
Outside ±2σ bands: Suggests extreme market conditions
Crossovers of standard deviation bands may signal potential reversals
Technical Details
The indicator combines volume with price location within a bar to determine buying/selling pressure, then normalizes these values using a rolling z-score calculation. This normalization allows for better historical comparison and more reliable overbought/oversold signals.
Best used in conjunction with price action and other indicators for confirmation of potential market turns or trend strength.
Open-source script
In true TradingView spirit, the creator of this script has made it open-source, so that traders can review and verify its functionality. Kudos to the author! While you can use it for free, remember that republishing the code is subject to our House Rules.
Disclaimer
The information and publications are not meant to be, and do not constitute, financial, investment, trading, or other types of advice or recommendations supplied or endorsed by TradingView. Read more in the Terms of Use.