OPEN-SOURCE SCRIPT
Arnaud Legoux Trend Aggregator | Lyro RS
Arnaud Legoux Trend Aggregator
Introduction
Arnaud Legoux Trend Aggregator is a custom-built trend analysis tool that blends classic market oscillators with advanced normalization, advanced math functions and Arnaud Legoux smoothing. Unlike conventional indicators, 𝓐𝓛𝓣𝓐 aggregates market momentum, volatility and trend strength.

Signal Insight
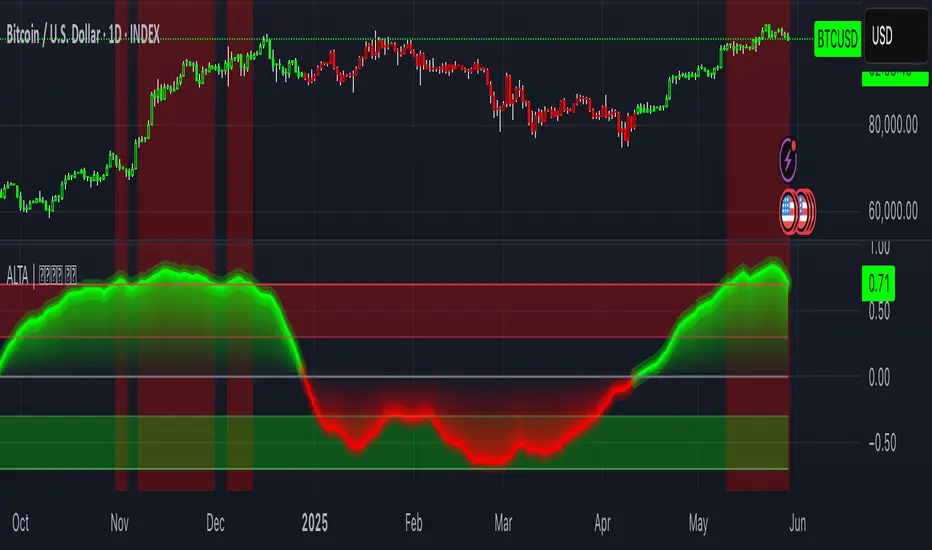
The 𝓐𝓛𝓣𝓐 line visually reflects the aggregated directional bias. A rise above the middle line threshold signals bullish strength, while a drop below the middle line indicates bearish momentum.
Another way to interpret the 𝓐𝓛𝓣𝓐 is through overbought and oversold conditions. When the 𝓐𝓛𝓣𝓐 rises above the +0.7 threshold, it suggests an overbought market and signals a strong uptrend. Conversely, a drop below the -0.7 level indicates an oversold condition and a strong downtrend.
When the oscillator hovers near the zero line, especially within the neutral ±0.3 band, it suggests that no single directional force is dominating—common during consolidation phases or pre-breakout compression.

Real-World Example
Usually 𝓐𝓛𝓣𝓐 is used by following the bar color for simple signals; however, like most indicators there are unique ways to use an indicator. Let’s dive deep into such ways.
The market begins with a green bar color, raising awareness for a potential long setup—but not a direct entry. In this methodology, bar coloring serves as an alert mechanism rather than a strict entry trigger.
The first long position was initiated when the 𝓐𝓛𝓣𝓐 signal line crossed above the +0.3 threshold, suggesting a shift in directional acceleration. This entry coincided with a rising price movement, validating the trade.
As price advanced, the position was exited into cash—not reversed into a short—because the short criteria for this use case are distinct. The exit was prompted by 𝓐𝓛𝓣𝓐 crossing back below the +0.3 level, signaling the potential weakening of the long trend.
Later, as 𝓐𝓛𝓣𝓐 crossed below 0, attention shifted toward short opportunities. A short entry was confirmed when 𝓐𝓛𝓣𝓐 dipped below -0.3, indicating growing downside momentum. The position was eventually closed when 𝓐𝓛𝓣𝓐 crossed back above the -0.3 boundary—signaling a possible deceleration of the bearish move.
This logic was consistently applied in subsequent setups, emphasizing the role of 𝓐𝓛𝓣𝓐’s thresholds in guiding both entries and exits.
Framework
The Arnaud Legoux Trend Aggregator (ALTA) combines multiple technical indicators into a single smoothed signal. It uses RSI, MACD, Bollinger Bands, Stochastic Momentum Index, and ATR.
Each indicator's output is normalized to a common scale to eliminate bias and ensure consistency. These normalized values are then transformed using a hyperbolic tangent function (Tanh).
The final score is refined with a custom Arnaud Legoux Moving Average (ALMA) function, which offers responsive smoothing that adapts quickly to price changes. This results in a clear signal that reacts efficiently to shifting market conditions.
⚠️ WARNING ⚠️: THIS INDICATOR, OR ANY OTHER WE (LYRO RS) PUBLISH, IS NOT FINANCIAL OR INVESTMENT ADVICE. EVERY INDICATOR SHOULD BE COMBINED WITH PRICE ACTION, FUNDAMENTALS, OTHER TECHNICAL ANALYSIS TOOLS & PROPER RISK. MANAGEMENT.
Introduction
Arnaud Legoux Trend Aggregator is a custom-built trend analysis tool that blends classic market oscillators with advanced normalization, advanced math functions and Arnaud Legoux smoothing. Unlike conventional indicators, 𝓐𝓛𝓣𝓐 aggregates market momentum, volatility and trend strength.
Signal Insight
The 𝓐𝓛𝓣𝓐 line visually reflects the aggregated directional bias. A rise above the middle line threshold signals bullish strength, while a drop below the middle line indicates bearish momentum.
Another way to interpret the 𝓐𝓛𝓣𝓐 is through overbought and oversold conditions. When the 𝓐𝓛𝓣𝓐 rises above the +0.7 threshold, it suggests an overbought market and signals a strong uptrend. Conversely, a drop below the -0.7 level indicates an oversold condition and a strong downtrend.
When the oscillator hovers near the zero line, especially within the neutral ±0.3 band, it suggests that no single directional force is dominating—common during consolidation phases or pre-breakout compression.
Real-World Example
Usually 𝓐𝓛𝓣𝓐 is used by following the bar color for simple signals; however, like most indicators there are unique ways to use an indicator. Let’s dive deep into such ways.
The market begins with a green bar color, raising awareness for a potential long setup—but not a direct entry. In this methodology, bar coloring serves as an alert mechanism rather than a strict entry trigger.
The first long position was initiated when the 𝓐𝓛𝓣𝓐 signal line crossed above the +0.3 threshold, suggesting a shift in directional acceleration. This entry coincided with a rising price movement, validating the trade.
As price advanced, the position was exited into cash—not reversed into a short—because the short criteria for this use case are distinct. The exit was prompted by 𝓐𝓛𝓣𝓐 crossing back below the +0.3 level, signaling the potential weakening of the long trend.
Later, as 𝓐𝓛𝓣𝓐 crossed below 0, attention shifted toward short opportunities. A short entry was confirmed when 𝓐𝓛𝓣𝓐 dipped below -0.3, indicating growing downside momentum. The position was eventually closed when 𝓐𝓛𝓣𝓐 crossed back above the -0.3 boundary—signaling a possible deceleration of the bearish move.
This logic was consistently applied in subsequent setups, emphasizing the role of 𝓐𝓛𝓣𝓐’s thresholds in guiding both entries and exits.
Framework
The Arnaud Legoux Trend Aggregator (ALTA) combines multiple technical indicators into a single smoothed signal. It uses RSI, MACD, Bollinger Bands, Stochastic Momentum Index, and ATR.
Each indicator's output is normalized to a common scale to eliminate bias and ensure consistency. These normalized values are then transformed using a hyperbolic tangent function (Tanh).
The final score is refined with a custom Arnaud Legoux Moving Average (ALMA) function, which offers responsive smoothing that adapts quickly to price changes. This results in a clear signal that reacts efficiently to shifting market conditions.
⚠️ WARNING ⚠️: THIS INDICATOR, OR ANY OTHER WE (LYRO RS) PUBLISH, IS NOT FINANCIAL OR INVESTMENT ADVICE. EVERY INDICATOR SHOULD BE COMBINED WITH PRICE ACTION, FUNDAMENTALS, OTHER TECHNICAL ANALYSIS TOOLS & PROPER RISK. MANAGEMENT.
Open-source script
In true TradingView spirit, the creator of this script has made it open-source, so that traders can review and verify its functionality. Kudos to the author! While you can use it for free, remember that republishing the code is subject to our House Rules.
Disclaimer
The information and publications are not meant to be, and do not constitute, financial, investment, trading, or other types of advice or recommendations supplied or endorsed by TradingView. Read more in the Terms of Use.