OPEN-SOURCE SCRIPT
Updated DIOSC indicator
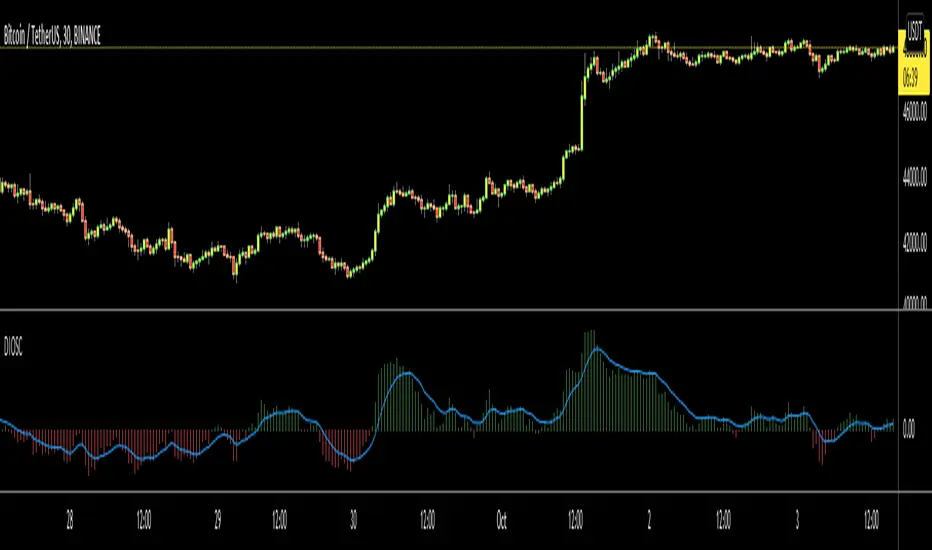
The Diosc indicator based on DMI is the combined version of -DI and +DI. While +DI is above (the trend is up), +DI is used and in the other case -DI is used. In addition, 9-day EMA was added to the graph so that sell/buy points could be seen on the histogram. Both sell/buy points and divergence/convergence can be followed on the graph.
[Turkish] Temeli DMI üzerine kurulmuş Diosc göstergesi -DI ve +DI'ın birleştirilmiş halidir. Temel mantığı +DI yukarıda iken yani trend yukarı iken +DI, diğer durumda da -DI göz önüne alınarak grafik oluşturulmuştur. Ek olarak Al-Sat noktalarının histogram üzerinde görülebilmesi için de grafiğe 9 günlük EMA eklenmiştir. Grafik üzerinde hem Al-Sat noktaları takip edilebilir hem de uyuşmazlıklar takip edilebilir.
[Turkish] Temeli DMI üzerine kurulmuş Diosc göstergesi -DI ve +DI'ın birleştirilmiş halidir. Temel mantığı +DI yukarıda iken yani trend yukarı iken +DI, diğer durumda da -DI göz önüne alınarak grafik oluşturulmuştur. Ek olarak Al-Sat noktalarının histogram üzerinde görülebilmesi için de grafiğe 9 günlük EMA eklenmiştir. Grafik üzerinde hem Al-Sat noktaları takip edilebilir hem de uyuşmazlıklar takip edilebilir.
Release Notes
upgraded to v4Open-source script
In true TradingView spirit, the creator of this script has made it open-source, so that traders can review and verify its functionality. Kudos to the author! While you can use it for free, remember that republishing the code is subject to our House Rules.
Disclaimer
The information and publications are not meant to be, and do not constitute, financial, investment, trading, or other types of advice or recommendations supplied or endorsed by TradingView. Read more in the Terms of Use.
Open-source script
In true TradingView spirit, the creator of this script has made it open-source, so that traders can review and verify its functionality. Kudos to the author! While you can use it for free, remember that republishing the code is subject to our House Rules.
Disclaimer
The information and publications are not meant to be, and do not constitute, financial, investment, trading, or other types of advice or recommendations supplied or endorsed by TradingView. Read more in the Terms of Use.