OPEN-SOURCE SCRIPT
Updated RSI Divergency and Golden Ratio
How to calculate:
Positive mismatch finds the lowest trough within the distance you choose. It then compares it to the current closing value.
If the past low is above the current closing level, it means that the bottoms of the price are descending.
The RSI level at the furthest bottom of the price is detected. And the current RSI level is detected. If the current RSI level is higher than the previous RSI level, there is a positive divergence.
When a positive divergence occurs, a green pole forms above the RSI indicator on the chart.
Negative finds the highest peak level within the distance you choose. It then compares it to the current closing value.
If the past high is below the current close, it means that the highs of the price are rising.
The RSI level at the furthest high of the price is detected. And the current RSI level is detected. If the current RSI level is lower than the previous RSI level, there is negative divergence.
When a negative divergence occurs, a red pole forms above the RSI indicator on the chart.

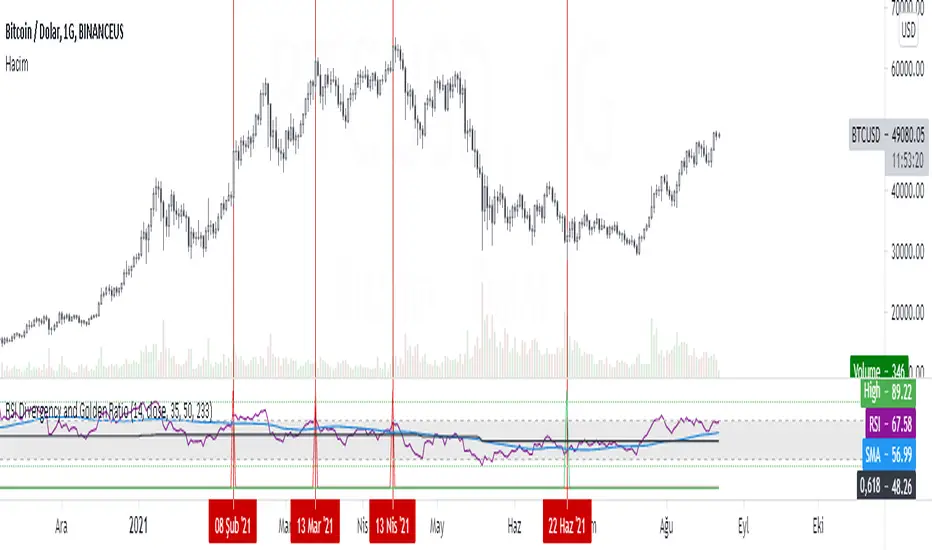
As can be seen in the image, the points marked with red are the regions where incompatibility occurs. At the same time, the signals that occur when the RSI cuts its own moving average and the signals that occur when the RSI cuts its own golden ratio are also very strong signals.
Waiting for your ideas and comments. I am open to criticism. We can improve.
Positive mismatch finds the lowest trough within the distance you choose. It then compares it to the current closing value.
If the past low is above the current closing level, it means that the bottoms of the price are descending.
The RSI level at the furthest bottom of the price is detected. And the current RSI level is detected. If the current RSI level is higher than the previous RSI level, there is a positive divergence.
When a positive divergence occurs, a green pole forms above the RSI indicator on the chart.
Negative finds the highest peak level within the distance you choose. It then compares it to the current closing value.
If the past high is below the current close, it means that the highs of the price are rising.
The RSI level at the furthest high of the price is detected. And the current RSI level is detected. If the current RSI level is lower than the previous RSI level, there is negative divergence.
When a negative divergence occurs, a red pole forms above the RSI indicator on the chart.
As can be seen in the image, the points marked with red are the regions where incompatibility occurs. At the same time, the signals that occur when the RSI cuts its own moving average and the signals that occur when the RSI cuts its own golden ratio are also very strong signals.
Waiting for your ideas and comments. I am open to criticism. We can improve.
Release Notes
Formule repairedRelease Notes
Add titleRelease Notes
Formule fixedOpen-source script
In true TradingView spirit, the creator of this script has made it open-source, so that traders can review and verify its functionality. Kudos to the author! While you can use it for free, remember that republishing the code is subject to our House Rules.
AlgoTrade sevdası.
Disclaimer
The information and publications are not meant to be, and do not constitute, financial, investment, trading, or other types of advice or recommendations supplied or endorsed by TradingView. Read more in the Terms of Use.
Open-source script
In true TradingView spirit, the creator of this script has made it open-source, so that traders can review and verify its functionality. Kudos to the author! While you can use it for free, remember that republishing the code is subject to our House Rules.
AlgoTrade sevdası.
Disclaimer
The information and publications are not meant to be, and do not constitute, financial, investment, trading, or other types of advice or recommendations supplied or endorsed by TradingView. Read more in the Terms of Use.