OPEN-SOURCE SCRIPT
Updated True Seasonal Pattern [tradeviZion]
True Seasonal Pattern: Uncover Hidden Market Cycles
Markets have rhythms and patterns that repeat with surprising regularity. The True Seasonal Pattern indicator reveals these hidden cycles across different timeframes, helping you anticipate potential market movements based on historical seasonal tendencies.
What This Indicator Does
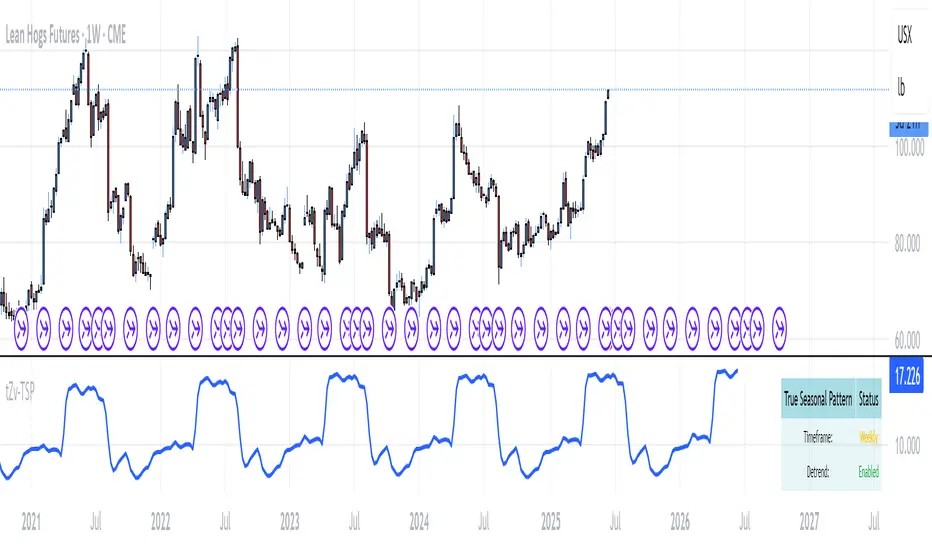
The True Seasonal Pattern analyzes years of historical price data to identify recurring seasonal trends. It then plots these patterns on your chart, showing you both the historical pattern and future projection based on past seasonal behavior.
How to Use This Indicator
Best Applications
Practical Applications
Pro Tip: For best results, use this tool on instruments with at least 5+ years of historical data. Longer timeframes often reveal more reliable seasonal patterns.
Important Notes
Pine Script®
I developed this indicator to help traders incorporate seasonal analysis into their trading approach without the complexity of traditional seasonal tools. Whether you're analyzing agricultural commodities, energy futures, or stock indices, understanding the seasonal context can provide valuable insights for your trading decisions.
Markets have rhythms and patterns that repeat with surprising regularity. The True Seasonal Pattern indicator reveals these hidden cycles across different timeframes, helping you anticipate potential market movements based on historical seasonal tendencies.
What This Indicator Does
The True Seasonal Pattern analyzes years of historical price data to identify recurring seasonal trends. It then plots these patterns on your chart, showing you both the historical pattern and future projection based on past seasonal behavior.
- Automatic Timeframe Detection: Works with Monthly, Weekly, and Daily charts
- Historical Pattern Analysis: Analyzes up to 100 years of data (customizable)
- Future Projection: Projects the seasonal pattern ahead on your chart
- Smart Smoothing: Applies appropriate smoothing based on your timeframe
How to Use This Indicator
- Add the indicator to a Daily, Weekly, or Monthly chart (not designed for intraday timeframes)
- The indicator automatically detects your chart's timeframe
- The blue line shows the historical seasonal pattern
- Watch for potential turning points in the pattern that align with other technical signals
Seasonal patterns work best as a supporting factor in your analysis, not as standalone trading signals. They are particularly effective in markets with well-established seasonal influences.
Best Applications
- Futures Markets: Commodities and futures often show strong seasonal tendencies due to production cycles, weather patterns, and economic factors
- Stock Indices: Many stock markets demonstrate regular seasonal patterns (like the "Sell in May" phenomenon)
- Individual Stocks: Companies with seasonal business cycles often show predictable price patterns
Practical Applications
- Identify potential turning points based on historical seasonal patterns
- Plan entries and exits around seasonal tendencies
- Add seasonal context to your existing technical analysis
- Understand why certain months or periods might show consistent behavior
Pro Tip: For best results, use this tool on instruments with at least 5+ years of historical data. Longer timeframes often reveal more reliable seasonal patterns.
Important Notes
- This indicator works best on Daily, Weekly, and Monthly timeframes - not intraday charts
- Seasonal patterns are tendencies, not guarantees
- Always combine seasonal analysis with other technical tools
- Past patterns may not repeat exactly in the future
// Sample of the seasonal calculation approach
float yearHigh = array.max(currentYearHighs)
float yearLow = array.min(currentYearLows)
// Calculate seasonality for each period
for i = 0 to array.size(currentYearCloses) - 1
float periodClose = array.get(currentYearCloses, i)
if not na(periodClose) and yearHigh != yearLow
float seasonality = (periodClose - yearLow) / (yearHigh - yearLow) * 100
I developed this indicator to help traders incorporate seasonal analysis into their trading approach without the complexity of traditional seasonal tools. Whether you're analyzing agricultural commodities, energy futures, or stock indices, understanding the seasonal context can provide valuable insights for your trading decisions.
Remember: Markets don't always follow seasonal patterns, but when they do, being aware of these tendencies can give you a meaningful edge in your analysis.
Release Notes
Version 2.0 Update - Released June 16, 2025What's New
Enhanced Calculation
New cumulative approach eliminates choppy transitions. Smoother, more reliable patterns.
Detrending Feature
Optional setting removes market trends to isolate pure seasonal patterns. Useful for trending markets.
Interface Updates
- Auto dark/light theme detection
- Optional status table
Technical Changes
var float seasonalPerformance = 0.0
float priceChange = close - close[lookback]
float weightedSeasonal = array.get(seasonalData, periodIndex) / totalMoves
seasonalPerformance := seasonalPerformance + weightedSeasonal
V1 vs V2 Visual Comparison
Side-by-Side Comparison:
Notice the smoother, more consistent patterns in V2 (top) compared to the choppy transitions in V1 (bottom).
Detrending Feature in Action:
V2's detrending capability isolates pure seasonal patterns by removing market trends, revealing cleaner cyclical behavior.
Enhanced Pattern Clarity:
V2's without detrending capability.
If you find this indicator useful, please give it a boost so other traders can discover it too!
Open-source script
In true TradingView spirit, the creator of this script has made it open-source, so that traders can review and verify its functionality. Kudos to the author! While you can use it for free, remember that republishing the code is subject to our House Rules.
TradeVizion™
For our premium indicators! whop.com/tradevizion/
For our premium indicators! whop.com/tradevizion/
Disclaimer
The information and publications are not meant to be, and do not constitute, financial, investment, trading, or other types of advice or recommendations supplied or endorsed by TradingView. Read more in the Terms of Use.