OPEN-SOURCE SCRIPT
Updated Institutional Bias
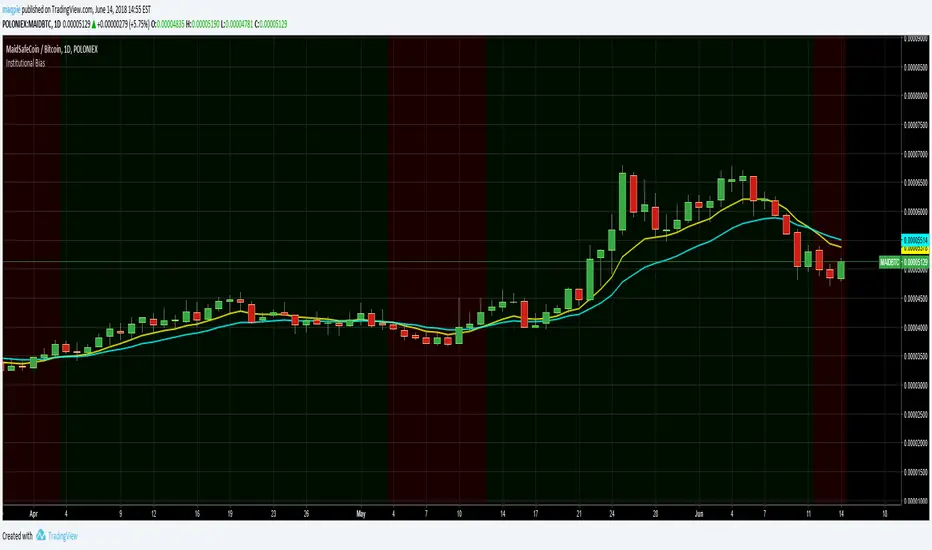
Shows what we at TRI call the institutional bias, i.e. a bull bias when 9 ema is above 18 ema and a bear bias when the 9 ema is below the 18 ema.
Plots the 9 and 18 ema, and fills the background green when the institutional bias is bullish and red when it is bearish.
Plots the 9 and 18 ema, and fills the background green when the institutional bias is bullish and red when it is bearish.
Release Notes
Institutional Bias is usually based on the daily time frame. By default the script will use the daily to determine the bias but you can turn it off to simply see the ema cross of the chart's time frame instead.
For example, a 4h chart will by default still use the daily time frame to determine institutional bias.
Please let me know of any improvements that could be made to this indicator. Happy trading!
Release Notes
Previous preview/example chart was clogged with other indicators. Open-source script
In true TradingView spirit, the creator of this script has made it open-source, so that traders can review and verify its functionality. Kudos to the author! While you can use it for free, remember that republishing the code is subject to our House Rules.
Disclaimer
The information and publications are not meant to be, and do not constitute, financial, investment, trading, or other types of advice or recommendations supplied or endorsed by TradingView. Read more in the Terms of Use.
Open-source script
In true TradingView spirit, the creator of this script has made it open-source, so that traders can review and verify its functionality. Kudos to the author! While you can use it for free, remember that republishing the code is subject to our House Rules.
Disclaimer
The information and publications are not meant to be, and do not constitute, financial, investment, trading, or other types of advice or recommendations supplied or endorsed by TradingView. Read more in the Terms of Use.