OPEN-SOURCE SCRIPT
The LBF model

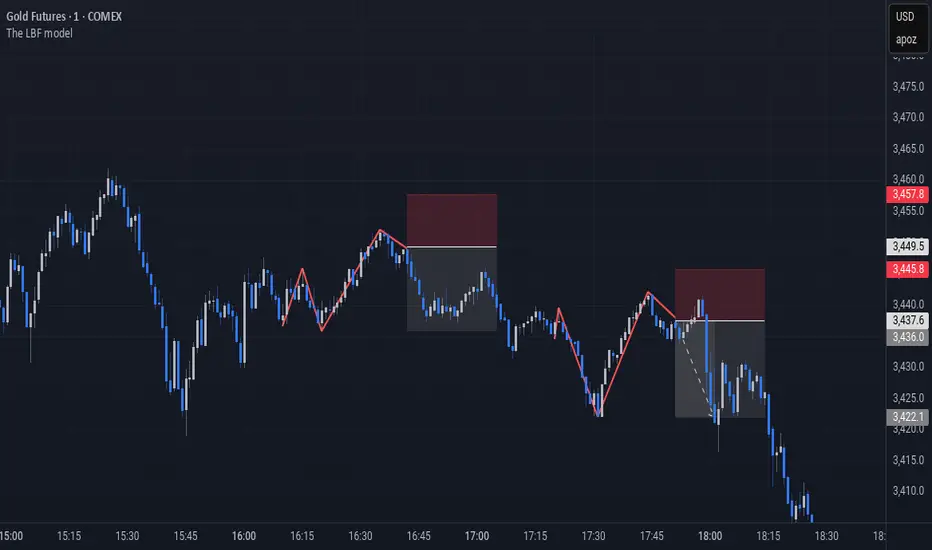
The LBF Model is a structural pattern detector that highlights potential reversal zones using a specific sequence of pivot points. It identifies both bearish (LL → LH → LL → HH → LH) and bullish (HH → HL → HH → LL → HL) formations, marking moments where price shows signs of exhaustion and directional shift.
Built purely on price action, the LBF Model avoids indicators and focuses on clean structure. It draws patterns directly on the chart, with customizable sensitivity and colors. Whether used on its own or with other tools, it helps traders spot key turning points with clarity and precision.
Built purely on price action, the LBF Model avoids indicators and focuses on clean structure. It draws patterns directly on the chart, with customizable sensitivity and colors. Whether used on its own or with other tools, it helps traders spot key turning points with clarity and precision.
Open-source script
In true TradingView spirit, the creator of this script has made it open-source, so that traders can review and verify its functionality. Kudos to the author! While you can use it for free, remember that republishing the code is subject to our House Rules.
Disclaimer
The information and publications are not meant to be, and do not constitute, financial, investment, trading, or other types of advice or recommendations supplied or endorsed by TradingView. Read more in the Terms of Use.